- Function File: dist
= geodeticarc(pt1, pt2)¶ - Function File: dist
= geodeticarc(pt1, pt2, ellipsoid)¶ - Function File:
[dist, az] =geodeticarc(pt1, pt2) ¶ - Function File:
[dist, az] =geodeticarc(pt1, pt2, ellipsoid) ¶ Calculates the distance (in meters) between two (sets of) locations on an ellipsoid.
The formula devised by Thaddeus Vincenty (1975) is used with an accurate ellipsoidal model of the earth (ellipsoid).
Note: for antipodal points (within 0.5 degree) Vincenty’s formulae are known to be inaccurate and may even break down.Inputs:
- pt1 and pt2 are two-column matrices of the form
[latitude longitude]. The units for the input coordinates angles must be degrees. - Optional argument ellipsoid defines the reference ellipsoid to use. The default ellipsoidal model is ’WGS84’, which is the globally most accurate model.
Outputs:
- dist is the computed distance between pt1 and pt2 in meters, computed along the shortest geodesic.
- az is a 2-column array of starting and ending azimuths of the geodesics in the direction from pt1 to pt2, in degrees relative to the North (clockwise).
Examples:
>> geodeticarc ([37, -76], [37, -9])
ans = 5830081.06
>> geodeticarc ([37, -76], [67, -76], referenceEllipsoid (7019))
ans = 3337842.87
See also: distance, geodeticfwd, referenceEllipsoid, vincenty.
- pt1 and pt2 are two-column matrices of the form
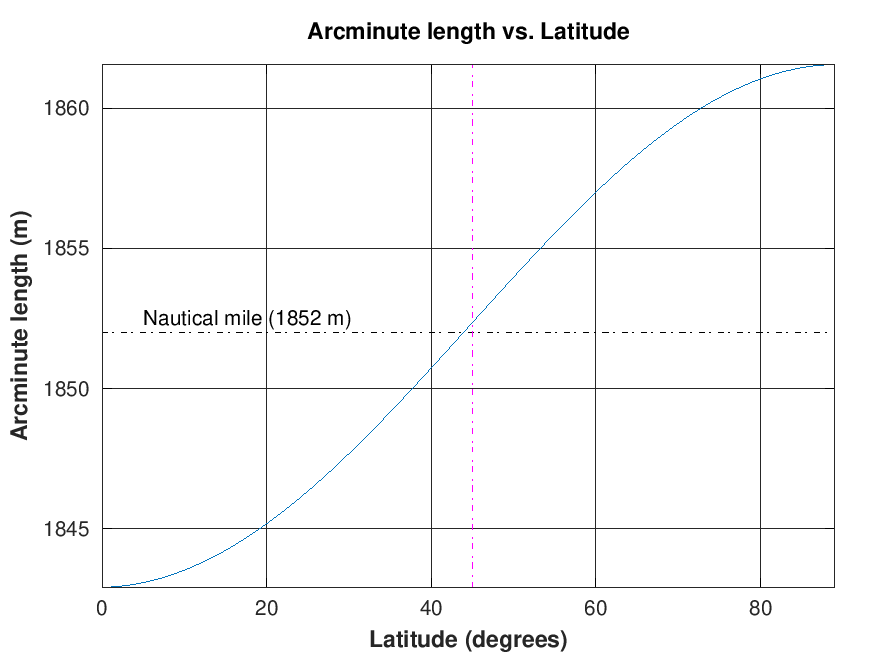
Demonstration 1
The following code
 lgts = geodeticarc ([[0:1:89]', zeros(90, 1)], [[1:1:90]', zeros(90, 1)]) / 60;
 plot (0:89, lgts);
 axis tight;
 grid on;
 hold on;
 plot ([0 89], [1852 1852], "k", "linestyle", "-.");
 plot ([45 45], [min(lgts) max(lgts)], "m", "linestyle", "-.");
 title ("Arcminute length vs. Latitude");
 xlabel ("Latitude (degrees)", "FontWeight", "bold");
 ylabel ("Arcminute length (m)", "FontWeight", "bold");
 text (5, 1852.5, "Nautical mile (1852 m)");
Produces the following output
warning: using the gnuplot graphics toolkit is discouraged

The gnuplot graphics toolkit is not actively maintained and has a number
of limitations that are unlikely to be fixed.  Communication with gnuplot
uses a one-directional pipe and limited information is passed back to the
Octave interpreter so most changes made interactively in the plot window
will not be reflected in the graphics properties managed by Octave.  For
example, if the plot window is closed with a mouse click, Octave will not
be notified and will not update its internal list of open figure windows.
The qt toolkit is recommended instead.
and the following figure
| Figure 1 |
|---|
 |
Package: mapping