- Function File: [U, R, Q, X] = qncscmva (N, S, Sld, V)
- Function File: [U, R, Q, X] = qncscmva (N, S, Sld, V, Z)
-
Conditional MVA (CMVA) algorithm, a numerically stable variant of MVA. This function supports a network of M ≥ 1 service centers and a single delay center. Servers 1, …, (M-1) are load-independent; server M is load-dependent.
INPUTS
NNumber of requests in the system,
N ≥ 0. IfN == 0, this function returnsU = R = Q = X = 0S(k)mean service time on server k = 1, …, (M-1) (
S(k) > 0). If there are no fixed-rate servers, thenS = []Sld(n)inverse service rate at server M (the load-dependent server) when there are n requests, n=1, …, N.
Sld(n) =1 / \mu(n).V(k)average number of visits to service center k=1, …, M, where
V(k) ≥ 0.V(1:M-1)are the visit rates to the fixed rate servers;V(M)is the visit rate to the load dependent server.ZExternal delay for customers (
Z ≥ 0). Default is 0.
OUTPUTS
U(k)center k utilization (k=1, …, M)
R(k)response time of center k (k=1, …, M). The system response time Rsys can be computed as
Rsys = N/Xsys - ZQ(k)average number of requests at center k (k=1, …, M).
X(k)center k throughput (k=1, …, M).
REFERENCES
- G. Casale. A note on stable flow-equivalent aggregation in closed networks. Queueing Syst. Theory Appl., 60:193â-202, December 2008, 10.1007/s11134-008-9093-6
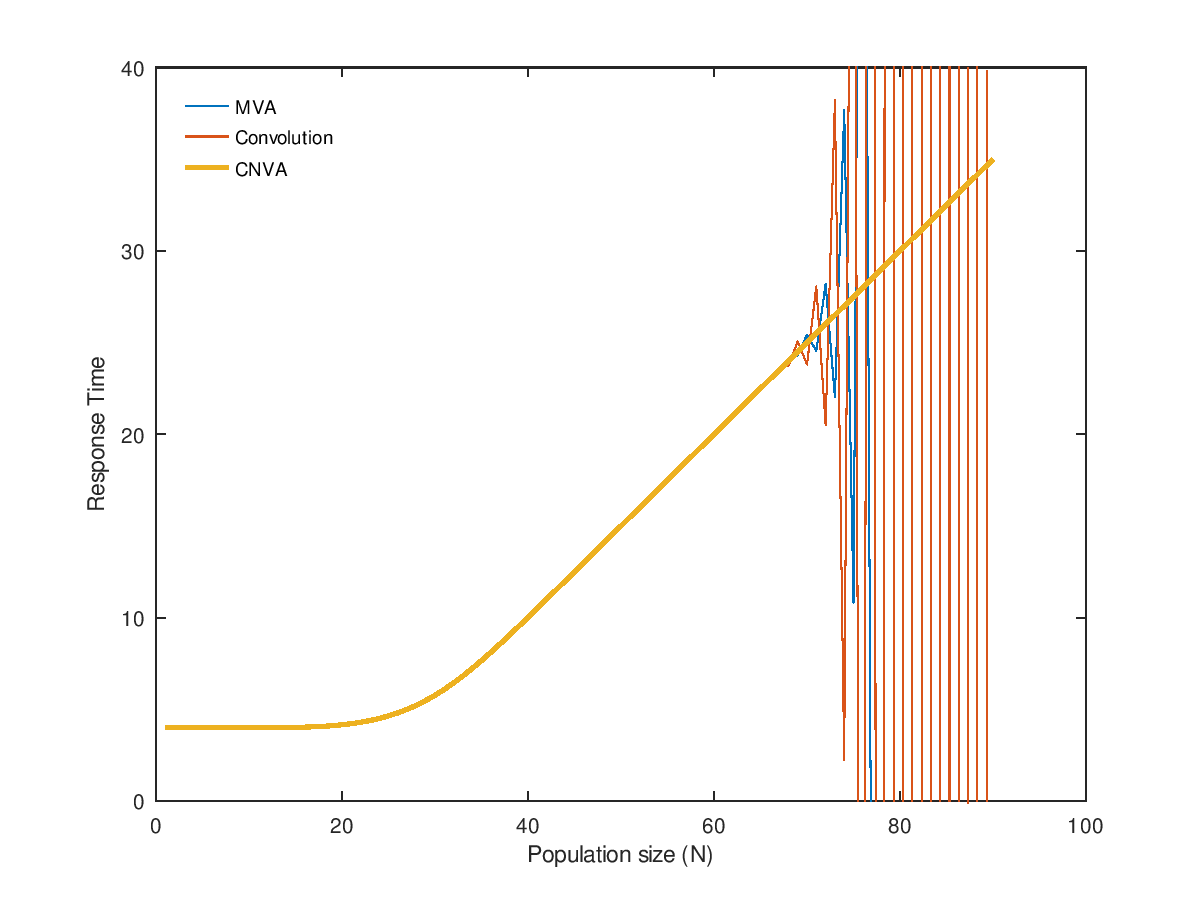
Demonstration 1
The following code
 maxN = 90; # Max population size
 Rmva = Rconv = Rcmva = zeros(1,maxN); # Results
 S = 4; Z = 10; m = 8;
 old = warning("query","qn:numerical-instability");
 warning("off","qn:numerical-instability");
 for N=1:maxN
   [U R] = qncsmva(N,S,1,m,Z);		# Use MVA
   Rmva(N) = R(1);
   [U R] = qncsconv(N,[S Z],[1 1],[m -1]);	# Use Convolution
   Rconv(N) = R(1);
   if ( N > m )
     Scmva = S ./ min(1:N,m);
   else
     Scmva = S ./ (1:N);
   endif
   [U R] = qncscmva(N,[],Scmva,1,Z);		# Use CMVA
   Rcmva(N) = R(1);
 endfor
 warning(old.state,"qn:numerical-instability");
 plot(1:maxN, Rmva, ";MVA;", ...
      1:maxN, Rconv, ";Convolution;", ...
      1:maxN, Rcmva, ";CNVA;", "linewidth",2);
 xlabel("Population size (N)");
 ylabel("Response Time");
 ax=axis(); ax(3) = 0; ax(4) = 40; axis(ax);
 legend("location","northwest"); legend("boxoff");
Produces the following figure
| Figure 1 |
|---|
 |
Package: queueing