- Function File:
[pks, loc, extra] =findpeaks(data)¶ - Function File:
… =findpeaks(…, property, value)¶ - Function File:
… =findpeaks(…, "DoubleSided")¶ Finds peaks on data.
Peaks of a positive array of data are defined as local maxima. For double-sided data, they are maxima of the positive part and minima of the negative part. data is expected to be a single column vector.
The function returns the value of data at the peaks in pks. The index indicating their position is returned in loc.
The third output argument is a structure with additional information:
- "parabol"
A structure containing the parabola fitted to each returned peak. The structure has two fields, "x" and "pp". The field "pp" contains the coefficients of the 2nd degree polynomial and "x" the extrema of the interval where it was fitted.
- "height"
The estimated height of the returned peaks (in units of data).
- "baseline"
The height at which the roots of the returned peaks were calculated (in units of data).
- "roots"
The abscissa values (in index units) at which the parabola fitted to each of the returned peaks realizes its width as defined below.
This function accepts property-value pair given in the list below:
- "MinPeakHeight"
Minimum peak height (non-negative scalar). Only peaks that exceed this value will be returned. For data taking positive and negative values use the option "DoubleSided". Default value
eps.- "MinPeakDistance"
Minimum separation between (positive integer). Peaks separated by less than this distance are considered a single peak. This distance is also used to fit a second order polynomial to the peaks to estimate their width, therefore it acts as a smoothing parameter. The neighborhood size is equal to the value of "MinPeakDistance". Default value 1.
- "MinPeakWidth"
Minimum width of peaks (positive integer). The width of the peaks is estimated using a parabola fitted to the neighborhood of each peak. The width is caulculated with the formula
a * (width - x0)^2 = 1
where a is the the concavity of the parabola and x0 its vertex. Default value 1.
- "MaxPeakWidth"
Maximum width of peaks (positive integer). Default value
Inf.- "DoubleSided"
Tells the function that data takes positive and negative values. The base-line for the peaks is taken as the mean value of the function. This is equivalent as passing the absolute value of the data after removing the mean.
Run
demo findpeaksto see some examples.
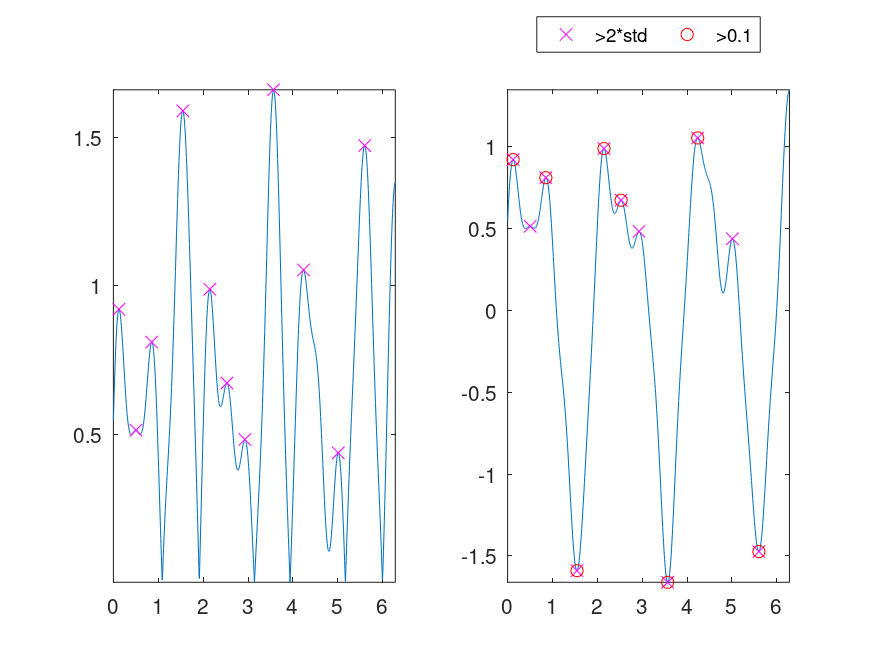
Demonstration 1
The following code
 t = 2*pi*linspace(0,1,1024)';
 y = sin(3.14*t) + 0.5*cos(6.09*t) + 0.1*sin(10.11*t+1/6) + 0.1*sin(15.3*t+1/3);

 data1 = abs(y); # Positive values
 [pks idx] = findpeaks(data1);

 data2 = y; # Double-sided
 [pks2 idx2] = findpeaks(data2,"DoubleSided");
 [pks3 idx3] = findpeaks(data2,"DoubleSided","MinPeakHeight",0.5);

 subplot(1,2,1)
 plot(t,data1,t(idx),data1(idx),'xm')
 axis tight
 subplot(1,2,2)
 plot(t,data2,t(idx2),data2(idx2),"xm;>2*std;",t(idx3),data2(idx3),"or;>0.1;")
 axis tight
 legend("Location","NorthOutside","Orientation","horizontal")

 #----------------------------------------------------------------------------
 # Finding the peaks of smooth data is not a big deal!
Produces the following figure
| Figure 1 |
|---|
 |
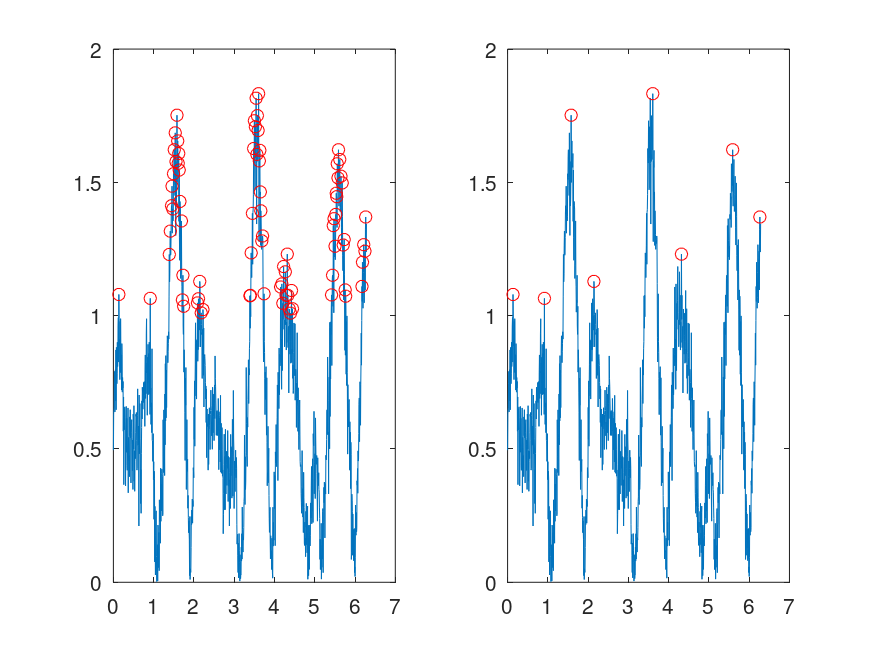
Demonstration 2
The following code
 t = 2*pi*linspace(0,1,1024)';
 y = sin(3.14*t) + 0.5*cos(6.09*t) + 0.1*sin(10.11*t+1/6) + 0.1*sin(15.3*t+1/3);

 data = abs(y + 0.1*randn(length(y),1)); # Positive values + noise
 [pks idx] = findpeaks(data,"MinPeakHeight",1);

 dt = t(2)-t(1);
 [pks2 idx2] = findpeaks(data,"MinPeakHeight",1,...
                              "MinPeakDistance",round(0.5/dt));

 subplot(1,2,1)
 plot(t,data,t(idx),data(idx),'or')
 subplot(1,2,2)
 plot(t,data,t(idx2),data(idx2),'or')

 #----------------------------------------------------------------------------
 # Noisy data may need tuning of the parameters. In the 2nd example,
 # MinPeakDistance is used as a smoother of the peaks.
Produces the following figure
| Figure 1 |
|---|
 |
Package: signal