- Function File: pzmap (sys)
- Function File: pzmap (sys1, sys2, …, sysN)
- Function File: pzmap (sys1, 'style1', …, sysN, 'styleN')
- Function File: [p, z] = pzmap (sys)
Plot the poles and zeros of an LTI system in the complex plane. If no output arguments are given, the result is plotted on the screen. Otherwise, the poles and zeros are computed and returned.
Inputs
- sys
LTI model.
- ’style’
Line style and color, e.g. ’r’ for a solid red line or ’-.k’ for a dash-dotted black line. See
help plotfor details.
Outputs
- p
Poles of sys.
- z
Invariant zeros of sys.
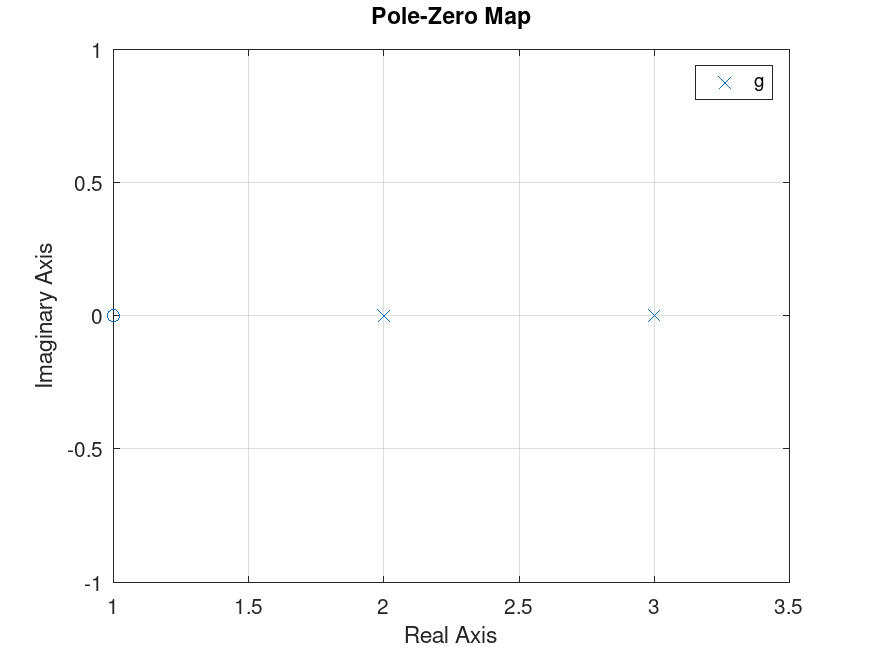
Demonstration 1
The following code
 s = tf('s');
 g = (s-1)/(s-2)/(s-3);
 pzmap(g);
Produces the following figure
| Figure 1 |
|---|
 |
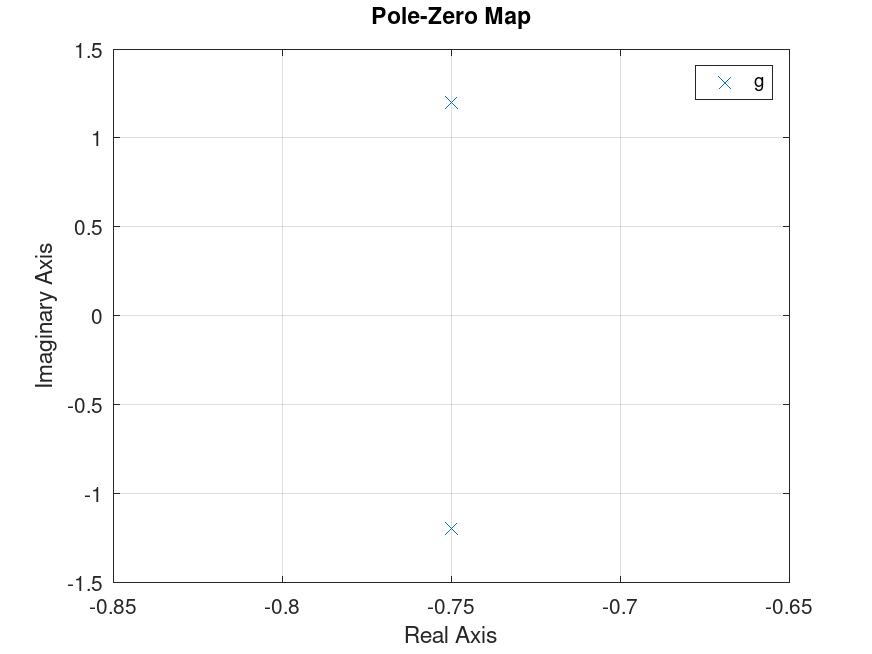
Demonstration 2
The following code
 s = tf('s');
 g = 1/(2*s^2+3*s+4);
 pzmap(g);
Produces the following figure
| Figure 1 |
|---|
 |
Package: control