- Function File: candle (HighPrices, LowPrices, ClosePrices, OpenPrices)
- Function File: candle (HighPrices, LowPrices, ClosePrices, OpenPrices, color)
- Function File: candle (HighPrices, LowPrices, ClosePrices, OpenPrices, color, dates)
- Function File: candle (HighPrices, LowPrices, ClosePrices, OpenPrices, color, dates, dateform)
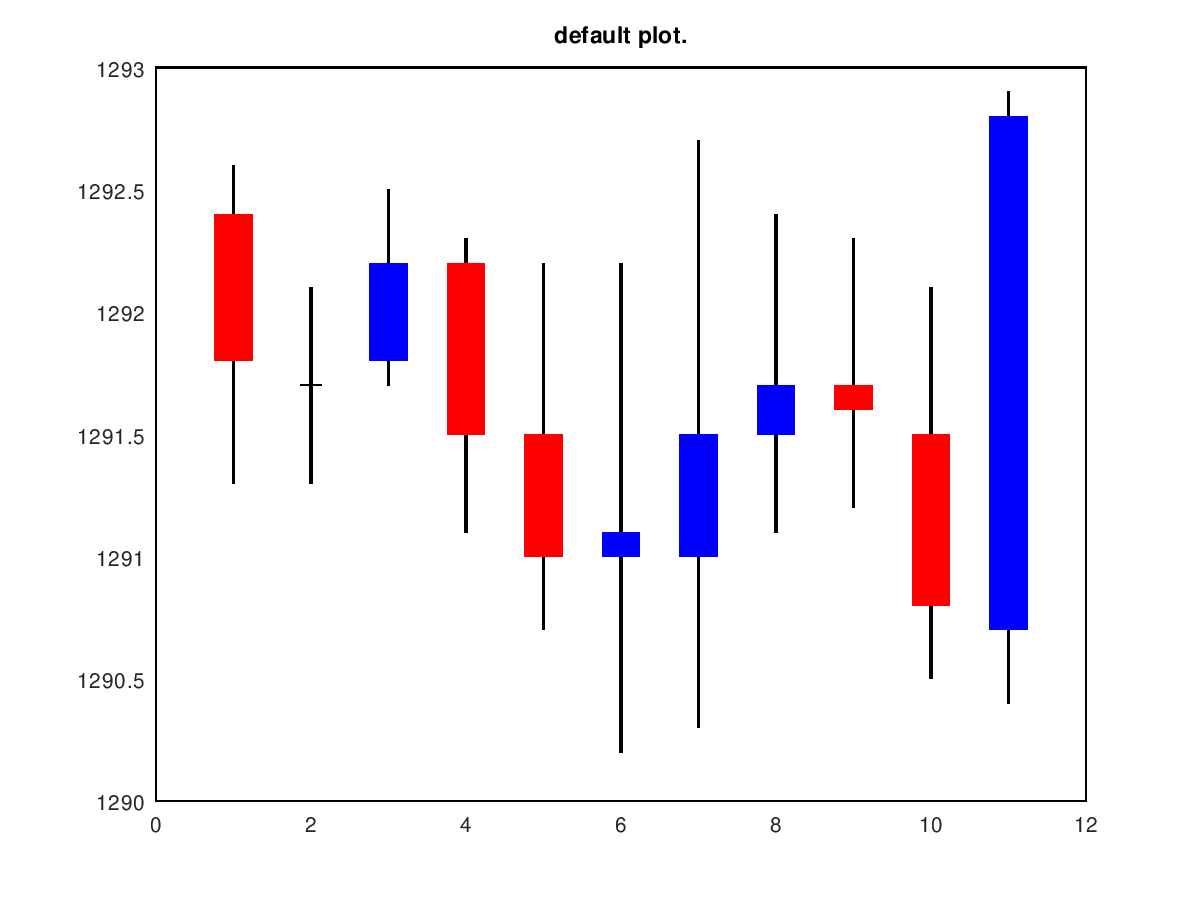
Plot the HighPrices, LowPrices, ClosePrices and OpenPrices of a security as a candlestick chart.
- Variable: HighPrices Column vector of high prices for a security.
- Variable: LowPrices Column vector of low prices for a security.
- Variable: ClosePrices Column vector of close prices for a security.
- Variable: OpenPrices Column vector of open prices for a security.
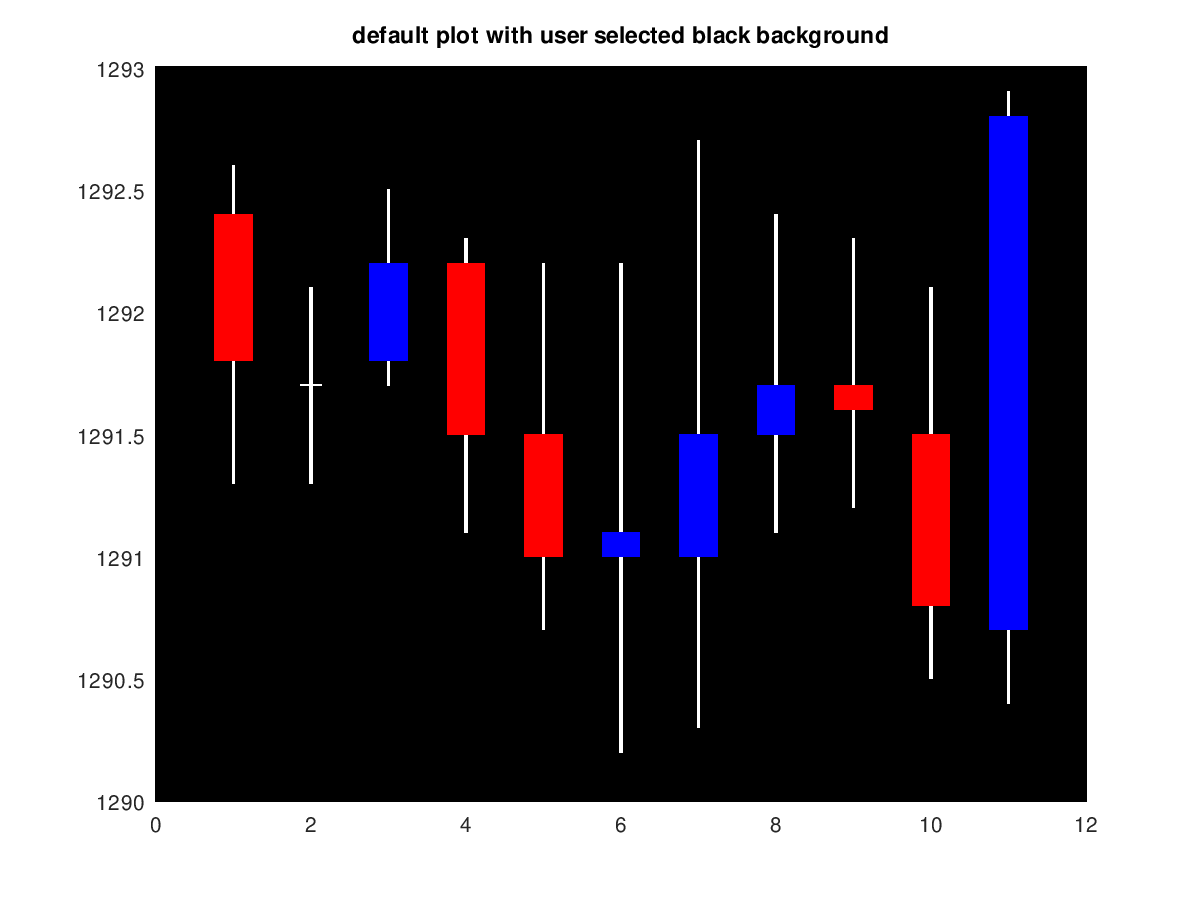
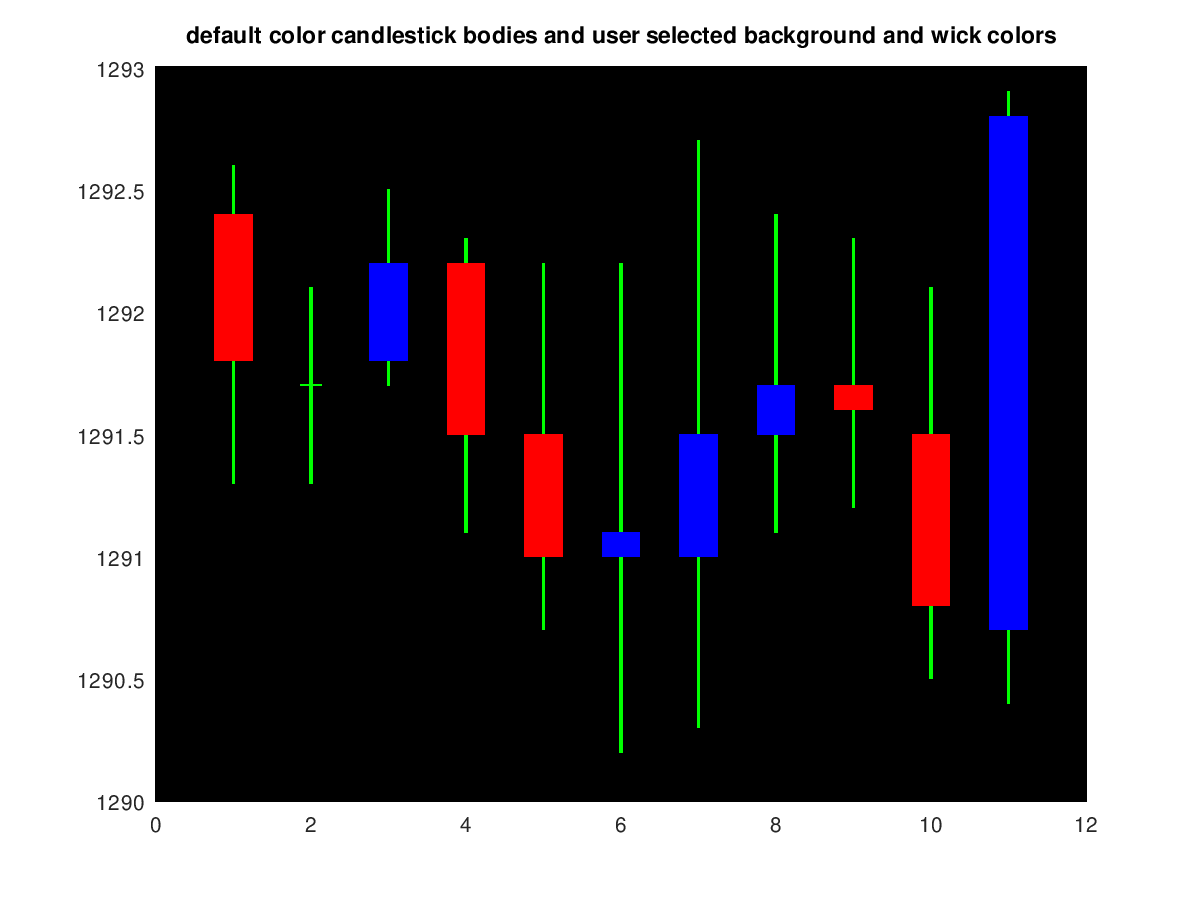
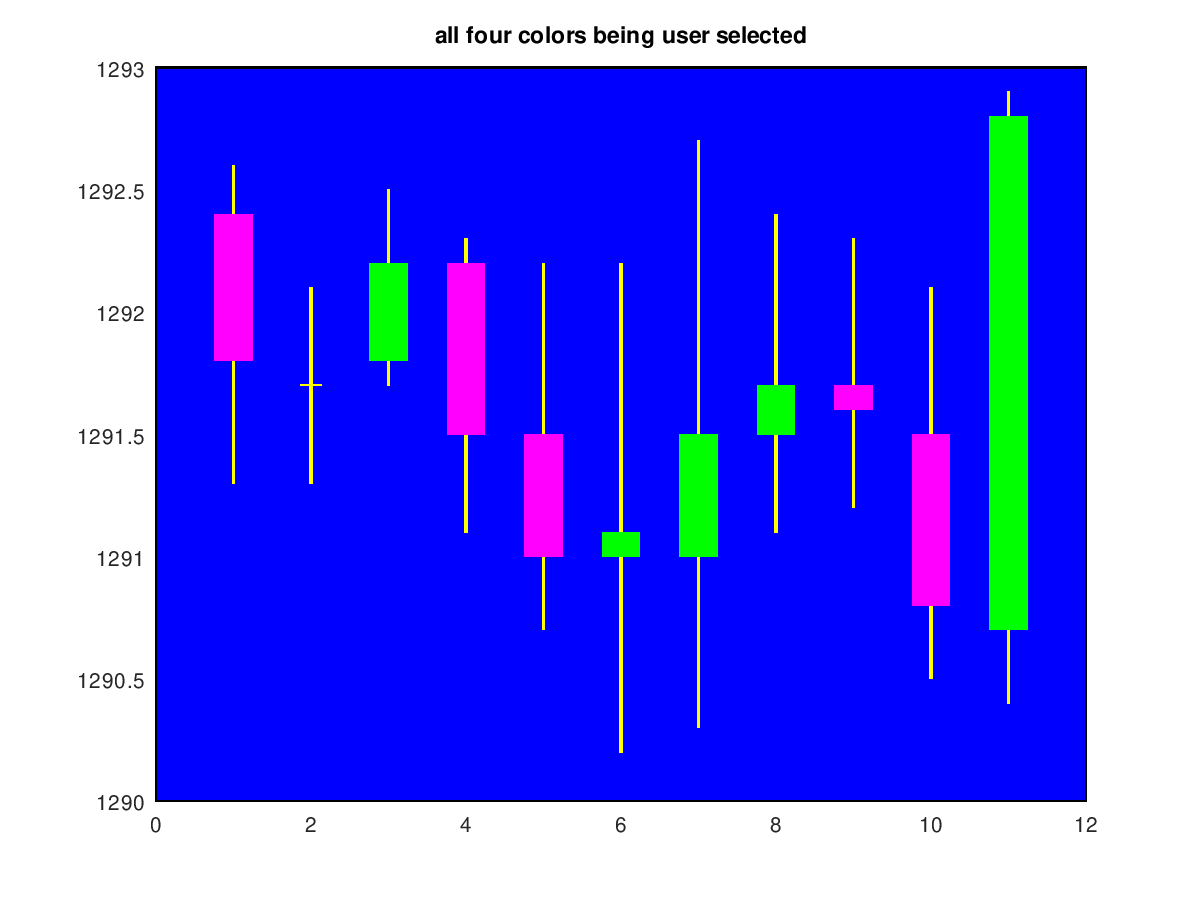
- Variable: Color (Optional, default = "brwk") Candlestick color is specified as a case insensitive four character row vector, e.g. "brwk". The characters that are accepted are k, b, c, r, m, w, g and y for black, blue, cyan, red, magenta, white, green and yellow respectively. Default colors are "brwk" applied in order to bars where the closing price is greater than the opening price, bars where the closing price is less than the opening price, the chart background color and the candlestick wicks. If fewer than four colors are specified, they are applied in turn in the above order with default colors for unspecified colors. For example, user supplied colors "gm" will plot green upbars and magenta downbars with a default white background and black wicks. If the user specified color for background is black, without specifying the wick color, e.g. "gmk", the default wick color is white. All other choices for background color will default to black for wicks. If all four colors are user specified, those colors will be used. Doji bars and single price bars, e.g. open = high = low = close, are plotted with the color for wicks, with single price bars being plotted as points/dots.
- Variable: Dates (Optional) Dates for user specified x-axis tick labels. Dates can be a serial date number column (see datenum), a datevec matrix (See datevec) or a character vector of dates. If specified as either a datenum or a datevec, the Dateform argument is required.
- Variable: Dateform (Optional) Either a date character string or a single integer code number used to format the x-axis tick labels (See datestr). Only required if Dates is specified as a serial date number column (See datenum) or a datevec matrix (See datevec).
See also: datenum, datestr, datevec, highlow, bolling, dateaxis, movavg, pointfig.
Demonstration 1
The following code
 1
 close();
 OpenPrices = [ 1292.4; 1291.7; 1291.8; 1292.2; 1291.5; 1291.0; 1291.0; 1291.5; 1291.7; 1291.5; 1290.7 ];
 HighPrices = [ 1292.6; 1292.1; 1292.5; 1292.3; 1292.2; 1292.2; 1292.7; 1292.4; 1292.3; 1292.1; 1292.9 ];
 LowPrices = [ 1291.3; 1291.3; 1291.7; 1291.1; 1290.7; 1290.2; 1290.3; 1291.1; 1291.2; 1290.5; 1290.4 ];
 ClosePrices = [ 1291.8; 1291.7; 1292.2; 1291.5; 1291.0; 1291.1; 1291.5; 1291.7; 1291.6; 1290.8; 1292.8 ];
 candle( HighPrices, LowPrices, ClosePrices, OpenPrices );
 title("default plot.");
Produces the following output
ans = 1
and the following figure
| Figure 1 |
|---|
 |
Demonstration 2
The following code
 2
 close();
 OpenPrices = [ 1292.4; 1291.7; 1291.8; 1292.2; 1291.5; 1291.0; 1291.0; 1291.5; 1291.7; 1291.5; 1290.7 ];
 HighPrices = [ 1292.6; 1292.1; 1292.5; 1292.3; 1292.2; 1292.2; 1292.7; 1292.4; 1292.3; 1292.1; 1292.9 ];
 LowPrices = [ 1291.3; 1291.3; 1291.7; 1291.1; 1290.7; 1290.2; 1290.3; 1291.1; 1291.2; 1290.5; 1290.4 ];
 ClosePrices = [ 1291.8; 1291.7; 1292.2; 1291.5; 1291.0; 1291.1; 1291.5; 1291.7; 1291.6; 1290.8; 1292.8 ];
 candle( HighPrices, LowPrices, ClosePrices, OpenPrices, 'brk' );
 title("default plot with user selected black background");
Produces the following output
ans = 2
and the following figure
| Figure 1 |
|---|
 |
Demonstration 3
The following code
 3
 close();
 OpenPrices = [ 1292.4; 1291.7; 1291.8; 1292.2; 1291.5; 1291.0; 1291.0; 1291.5; 1291.7; 1291.5; 1290.7 ];
 HighPrices = [ 1292.6; 1292.1; 1292.5; 1292.3; 1292.2; 1292.2; 1292.7; 1292.4; 1292.3; 1292.1; 1292.9 ];
 LowPrices = [ 1291.3; 1291.3; 1291.7; 1291.1; 1290.7; 1290.2; 1290.3; 1291.1; 1291.2; 1290.5; 1290.4 ];
 ClosePrices = [ 1291.8; 1291.7; 1292.2; 1291.5; 1291.0; 1291.1; 1291.5; 1291.7; 1291.6; 1290.8; 1292.8 ];
 candle( HighPrices, LowPrices, ClosePrices, OpenPrices, 'brkg' );
 title("default color candlestick bodies and user selected background and wick colors");
Produces the following output
ans = 3
and the following figure
| Figure 1 |
|---|
 |
Demonstration 4
The following code
 4
 close();
 OpenPrices = [ 1292.4; 1291.7; 1291.8; 1292.2; 1291.5; 1291.0; 1291.0; 1291.5; 1291.7; 1291.5; 1290.7 ];
 HighPrices = [ 1292.6; 1292.1; 1292.5; 1292.3; 1292.2; 1292.2; 1292.7; 1292.4; 1292.3; 1292.1; 1292.9 ];
 LowPrices = [ 1291.3; 1291.3; 1291.7; 1291.1; 1290.7; 1290.2; 1290.3; 1291.1; 1291.2; 1290.5; 1290.4 ];
 ClosePrices = [ 1291.8; 1291.7; 1292.2; 1291.5; 1291.0; 1291.1; 1291.5; 1291.7; 1291.6; 1290.8; 1292.8 ];
 candle( HighPrices, LowPrices, ClosePrices, OpenPrices, 'gmby' );
 title("all four colors being user selected");
Produces the following output
ans = 4
and the following figure
| Figure 1 |
|---|
 |
Demonstration 5
The following code
5
close();
OpenPrices = [ 1292.4; 1291.7; 1291.8; 1292.2; 1291.5; 1291.0; 1291.0; 1291.5; 1291.7; 1291.5; 1290.7 ];
HighPrices = [ 1292.6; 1292.1; 1292.5; 1292.3; 1292.2; 1292.2; 1292.7; 1292.4; 1292.3; 1292.1; 1292.9 ];
LowPrices = [ 1291.3; 1291.3; 1291.7; 1291.1; 1290.7; 1290.2; 1290.3; 1291.1; 1291.2; 1290.5; 1290.4 ];
ClosePrices = [ 1291.8; 1291.7; 1292.2; 1291.5; 1291.0; 1291.1; 1291.5; 1291.7; 1291.6; 1290.8; 1292.8 ];
datenum_vec = [ 7.3702e+05; 7.3702e+05 ;7.3702e+05; 7.3702e+05; 7.3702e+05; 7.3702e+05; 7.3702e+05; ...
7.3702e+05; 7.3702e+05; 7.3702e+05; 7.3702e+05 ];
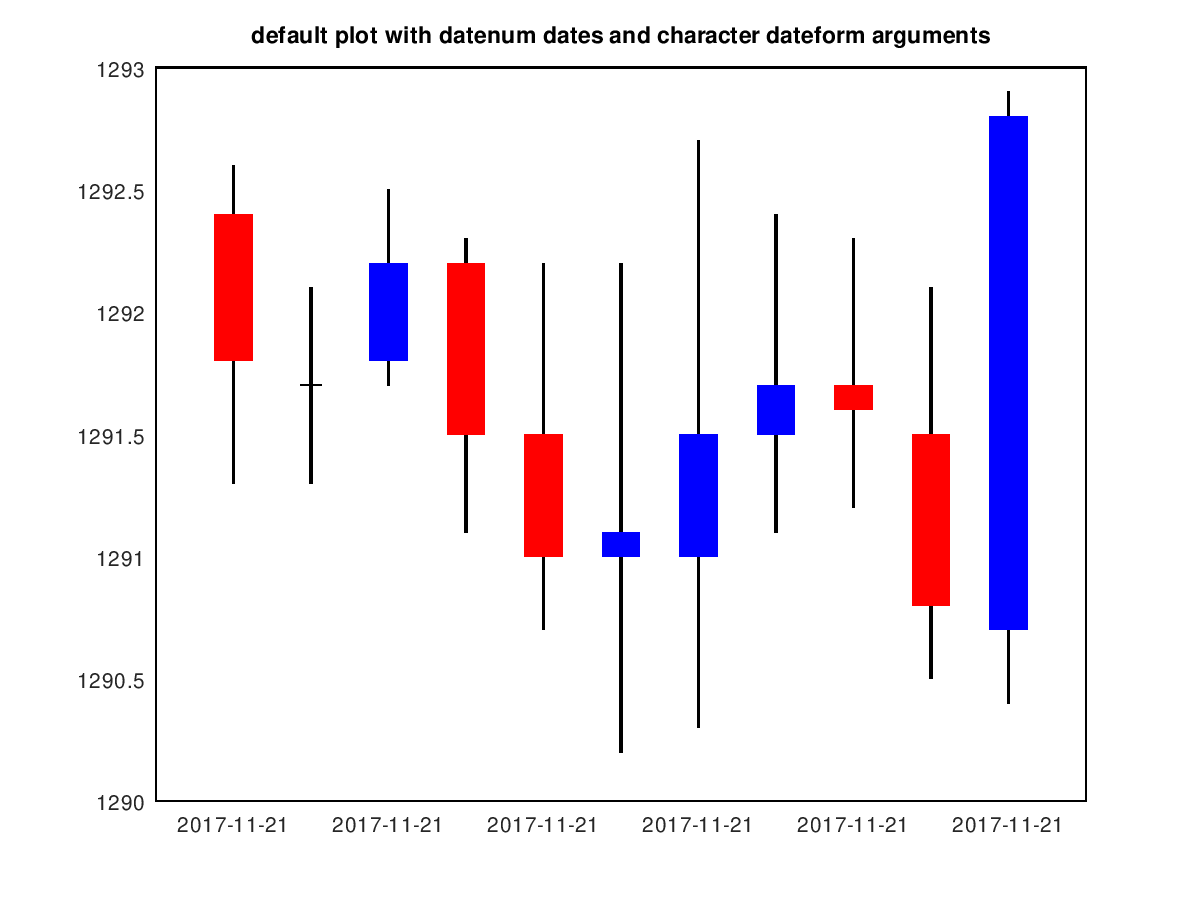
candle( HighPrices, LowPrices, ClosePrices, OpenPrices, 'brwk', datenum_vec, "yyyy-mm-dd" );
title("default plot with datenum dates and character dateform arguments");
Produces the following output
ans = 5
and the following figure
| Figure 1 |
|---|
 |
Demonstration 6
The following code
 6
 close();
 OpenPrices = [ 1292.4; 1291.7; 1291.8; 1292.2; 1291.5; 1291.0; 1291.0; 1291.5; 1291.7; 1291.5; 1290.7 ];
 HighPrices = [ 1292.6; 1292.1; 1292.5; 1292.3; 1292.2; 1292.2; 1292.7; 1292.4; 1292.3; 1292.1; 1292.9 ];
 LowPrices = [ 1291.3; 1291.3; 1291.7; 1291.1; 1290.7; 1290.2; 1290.3; 1291.1; 1291.2; 1290.5; 1290.4 ];
 ClosePrices = [ 1291.8; 1291.7; 1292.2; 1291.5; 1291.0; 1291.1; 1291.5; 1291.7; 1291.6; 1290.8; 1292.8 ];
 datenum_vec = [ 7.3702e+05; 7.3702e+05 ;7.3702e+05; 7.3702e+05; 7.3702e+05; 7.3702e+05; 7.3702e+05; ...
 7.3702e+05; 7.3702e+05; 7.3702e+05; 7.3702e+05 ];
 candle( HighPrices, LowPrices, ClosePrices, OpenPrices, 'brk', datenum_vec, 29 );
 title("default plot with user selected black background with datenum dates and integer dateform arguments");
Produces the following output
ans = 6
and the following figure
| Figure 1 |
|---|
 |
Demonstration 7
The following code
7
close();
OpenPrices = [ 1292.4; 1291.7; 1291.8; 1292.2; 1291.5; 1291.0; 1291.0; 1291.5; 1291.7; 1291.5; 1290.7 ];
HighPrices = [ 1292.6; 1292.1; 1292.5; 1292.3; 1292.2; 1292.2; 1292.7; 1292.4; 1292.3; 1292.1; 1292.9 ];
LowPrices = [ 1291.3; 1291.3; 1291.7; 1291.1; 1290.7; 1290.2; 1290.3; 1291.1; 1291.2; 1290.5; 1290.4 ];
ClosePrices = [ 1291.8; 1291.7; 1292.2; 1291.5; 1291.0; 1291.1; 1291.5; 1291.7; 1291.6; 1290.8; 1292.8 ];
datenum_vec = [ 7.3702e+05; 7.3702e+05 ;7.3702e+05; 7.3702e+05; 7.3702e+05; 7.3702e+05; 7.3702e+05; ...
7.3702e+05; 7.3702e+05; 7.3702e+05; 7.3702e+05 ];
datevec_vec = datevec( datenum_vec );
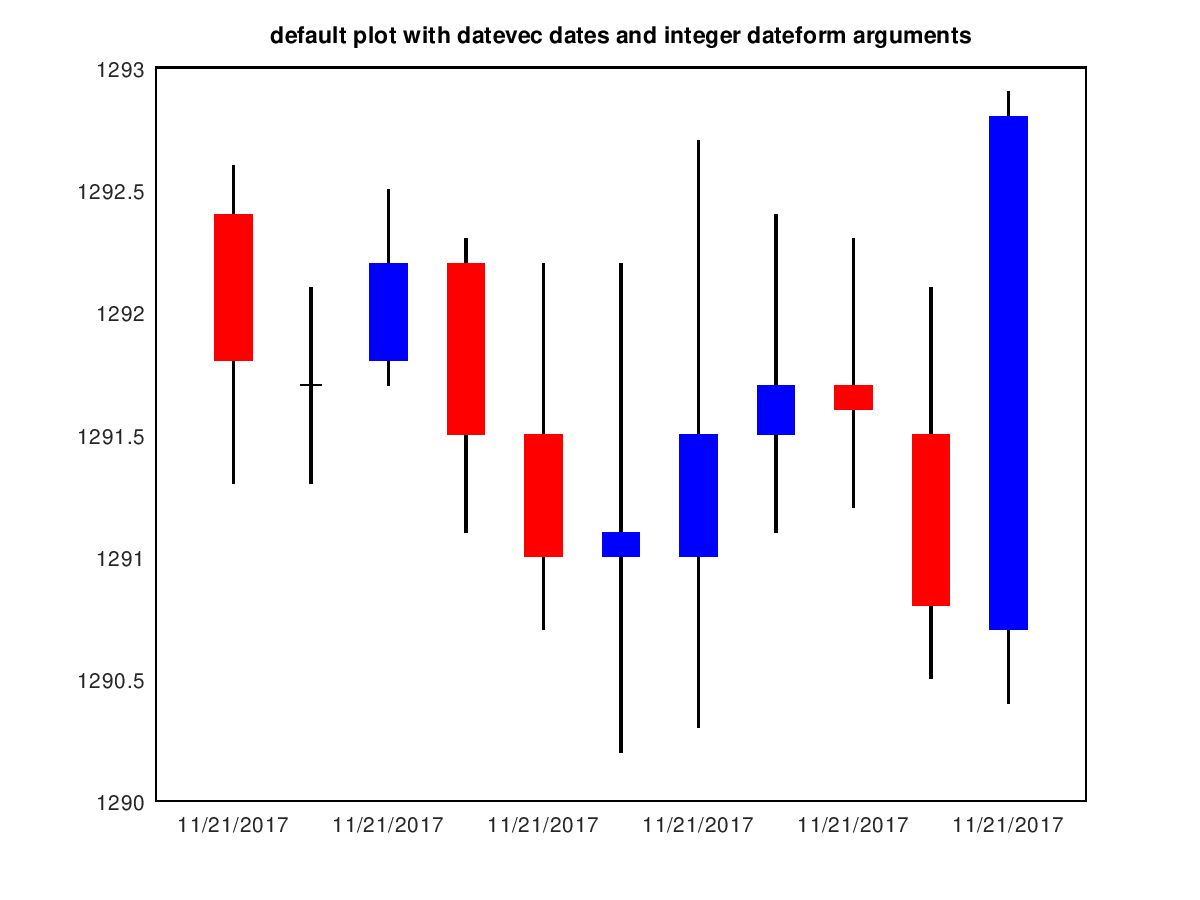
candle( HighPrices, LowPrices, ClosePrices, OpenPrices, 'brwk', datevec_vec, 23 );
title("default plot with datevec dates and integer dateform arguments");
Produces the following output
ans = 7
and the following figure
| Figure 1 |
|---|
 |
Demonstration 8
The following code
8
close();
OpenPrices = [ 1292.4; 1291.7; 1291.8; 1292.2; 1291.5; 1291.0; 1291.0; 1291.5; 1291.7; 1291.5; 1290.7 ];
HighPrices = [ 1292.6; 1292.1; 1292.5; 1292.3; 1292.2; 1292.2; 1292.7; 1292.4; 1292.3; 1292.1; 1292.9 ];
LowPrices = [ 1291.3; 1291.3; 1291.7; 1291.1; 1290.7; 1290.2; 1290.3; 1291.1; 1291.2; 1290.5; 1290.4 ];
ClosePrices = [ 1291.8; 1291.7; 1292.2; 1291.5; 1291.0; 1291.1; 1291.5; 1291.7; 1291.6; 1290.8; 1292.8 ];
character_dates = char ( [] );
for i = 1 : 11
character_dates = [ character_dates ; "a date" ] ;
endfor
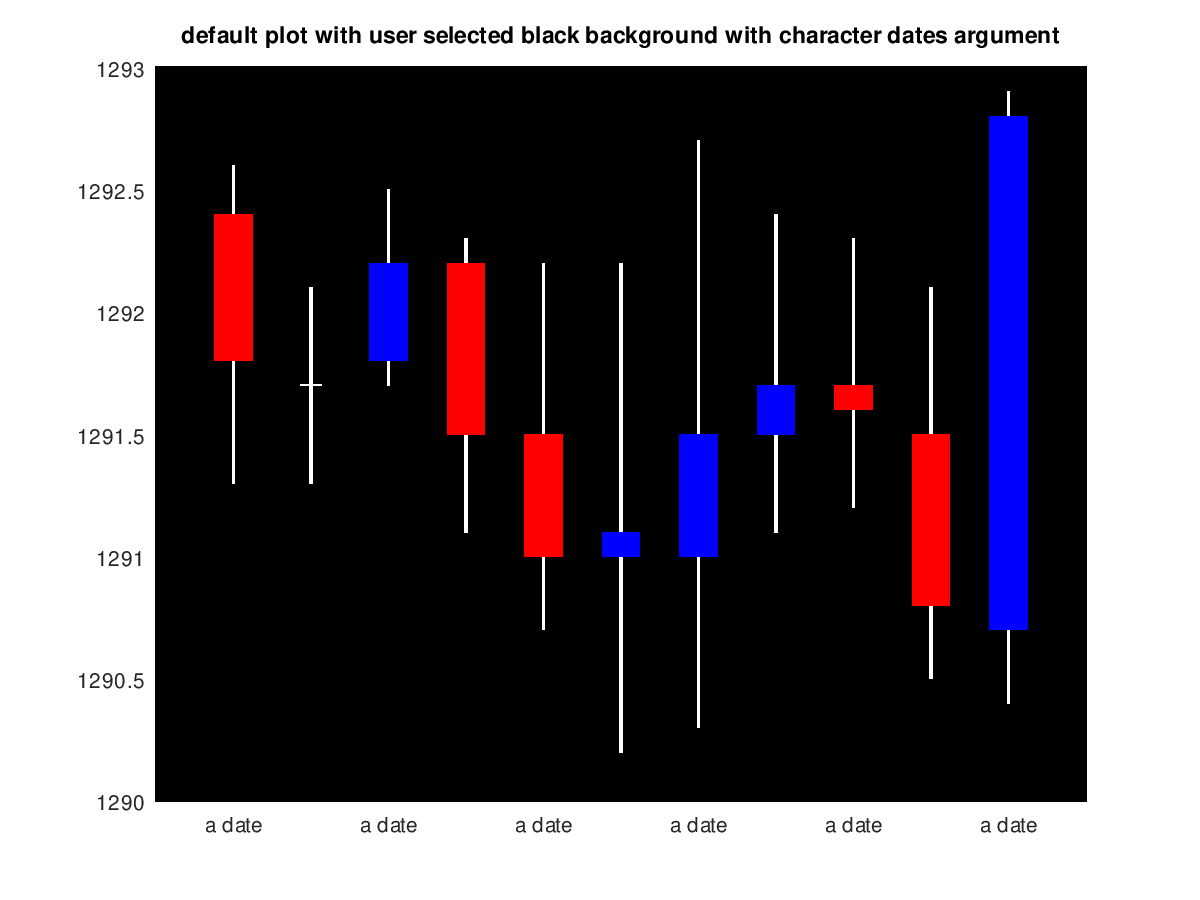
candle( HighPrices, LowPrices, ClosePrices, OpenPrices, 'brk', character_dates );
title("default plot with user selected black background with character dates argument");
Produces the following output
ans = 8
and the following figure
| Figure 1 |
|---|
 |
Package: financial