- Function File: y = evalmf (x, param, mf_type)
- Function File: y = evalmf (x, param, mf_type, hedge)
- Function File: y = evalmf (x, param, mf_type, hedge, not_flag)
- Function File: y = evalmf ([x1 x2 ... xn], [param1 ... ], mf_type)
- Function File: y = evalmf ([x1 x2 ... xn], [param1 ... ], mf_type, hedge)
- Function File: y = evalmf ([x1 x2 ... xn], [param1 ... ], mf_type, hedge, not_flag)
-
For a given domain, set of parameters, membership function type, and optional hedge and not_flag, return the corresponding y-values for the membership function.
The argument x must be a real number or a non-empty list of strictly increasing real numbers, param must be a valid parameter or a vector of valid parameters for mf_type, and mf_type must be a string corresponding to a membership function type. Evalmf handles both built-in and custom membership functions.
For custom hedges and the four built-in hedges "somewhat", "very", "extremely", and "very very", raise the membership function values to the power corresponding to the hedge.
(fraction == .05) <=>  somewhat x       <=>  mu(x)^0.5  <=>  sqrt(mu(x))
(fraction == .20) <=>  very x           <=>  mu(x)^2    <=>  sqr(mu(x))
(fraction == .30) <=>  extremely x      <=>  mu(x)^3    <=>  cube(mu(x))
(fraction == .40) <=>  very very x      <=>  mu(x)^4
(fraction == .dd) <=>  <custom hedge> x <=>  mu(x)^(dd/10)
The not_flag negates the membership function using:
mu(not(x)) = 1 - mu(x)
To run the demonstration code, type demo('evalmf') at the Octave prompt.
Demonstration 1
The following code
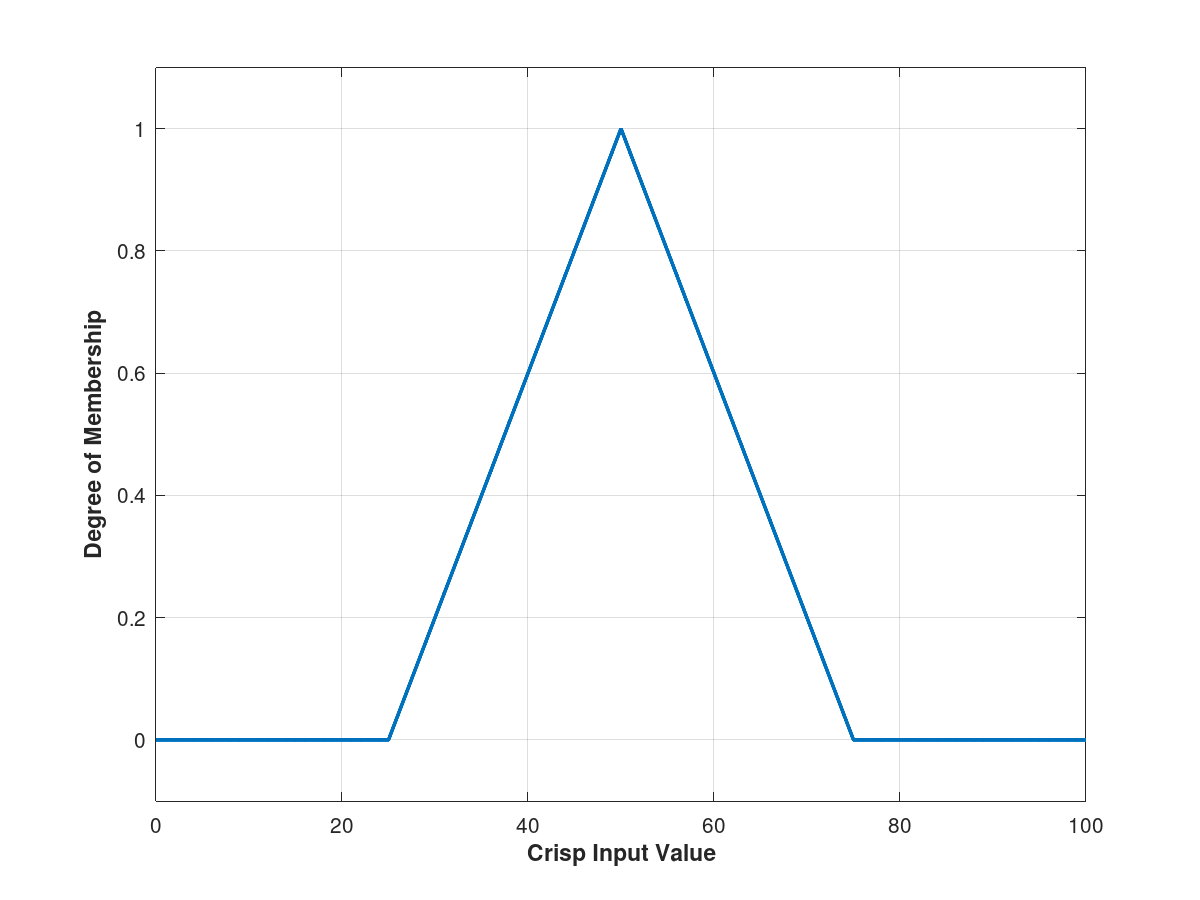
 x = 0:100;
 params = [25 50 75];
 mf_type = 'trimf';
 y = evalmf(x, params, mf_type);
 figure('NumberTitle', 'off', 'Name', "evalmf(0:100, [25 50 75], 'trimf')");
 plot(x, y, 'LineWidth', 2)
 ylim([-0.1 1.1]);
 xlabel('Crisp Input Value', 'FontWeight', 'bold');
 ylabel('Degree of Membership', 'FontWeight', 'bold');
 grid;
Produces the following figure
| Figure 1 |
|---|
 |
Package: fuzzy-logic-toolkit