- Function File: cluster_centers = fcm (input_data, num_clusters)
- Function File: cluster_centers = fcm (input_data, num_clusters, options)
- Function File: cluster_centers = fcm (input_data, num_clusters, [m, max_iterations, epsilon, display_intermediate_results])
- Function File: [cluster_centers, soft_partition, obj_fcn_history] = fcm (input_data, num_clusters)
- Function File: [cluster_centers, soft_partition, obj_fcn_history] = fcm (input_data, num_clusters, options)
- Function File: [cluster_centers, soft_partition, obj_fcn_history] = fcm (input_data, num_clusters, [m, max_iterations, epsilon, display_intermediate_results])
-
Using the Fuzzy C-Means algorithm, calculate and return the soft partition of a set of unlabeled data points.
Also, if display_intermediate_results is true, display intermediate results after each iteration. Note that because the initial cluster prototypes are randomly selected locations in the ranges determined by the input data, the results of this function are nondeterministic.
The required arguments to fcm are:
- input_data - a matrix of input data points; each row corresponds to one point
- num_clusters - the number of clusters to form
The optional arguments to fcm are:
- m - the parameter (exponent) in the objective function; default = 2.0
- max_iterations - the maximum number of iterations before stopping; default = 100
- epsilon - the stopping criteria; default = 1e-5
- display_intermediate_results - if 1, display results after each iteration, and if 0, do not; default = 1
The default values are used if any of the optional arguments are missing or evaluate to NaN.
The return values are:
- cluster_centers - a matrix of the cluster centers; each row corresponds to one point
- soft_partition - a constrained soft partition matrix
- obj_fcn_history - the values of the objective function after each iteration
Three important matrices used in the calculation are X (the input points to be clustered), V (the cluster centers), and Mu (the membership of each data point in each cluster). Each row of X and V denotes a single point, and Mu(i, j) denotes the membership degree of input point X(j, :) in the cluster having center V(i, :).
X is identical to the required argument input_data; V is identical to the output cluster_centers; and Mu is identical to the output soft_partition.
If n denotes the number of input points and k denotes the number of clusters to be formed, then X, V, and Mu have the dimensions:
                              1    2   ...  #features
                         1 [                           ]
   X  =  input_data  =   2 [                           ]
                       ... [                           ]
                         n [                           ]
1 2 ... #features 1 [ ] V = cluster_centers = 2 [ ] ... [ ] k [ ]1 2 ... n 1 [ ] Mu = soft_partition = 2 [ ] ... [ ] k [ ]See also: gustafson_kessel, partition_coeff, partition_entropy, xie_beni_index.
Demonstration 1
The following code
## This demo:
## - classifies a small set of unlabeled data points using
## the Fuzzy C-Means algorithm into two fuzzy clusters
## - plots the input points together with the cluster centers
## - evaluates the quality of the resulting clusters using
## three validity measures: the partition coefficient, the
## partition entropy, and the Xie-Beni validity index
##
## Note: The input_data is taken from Chapter 13, Example 17 in
## Fuzzy Logic: Intelligence, Control and Information, by
## J. Yen and R. Langari, Prentice Hall, 1999, page 381
## (International Edition).
## Use fcm to classify the input_data.
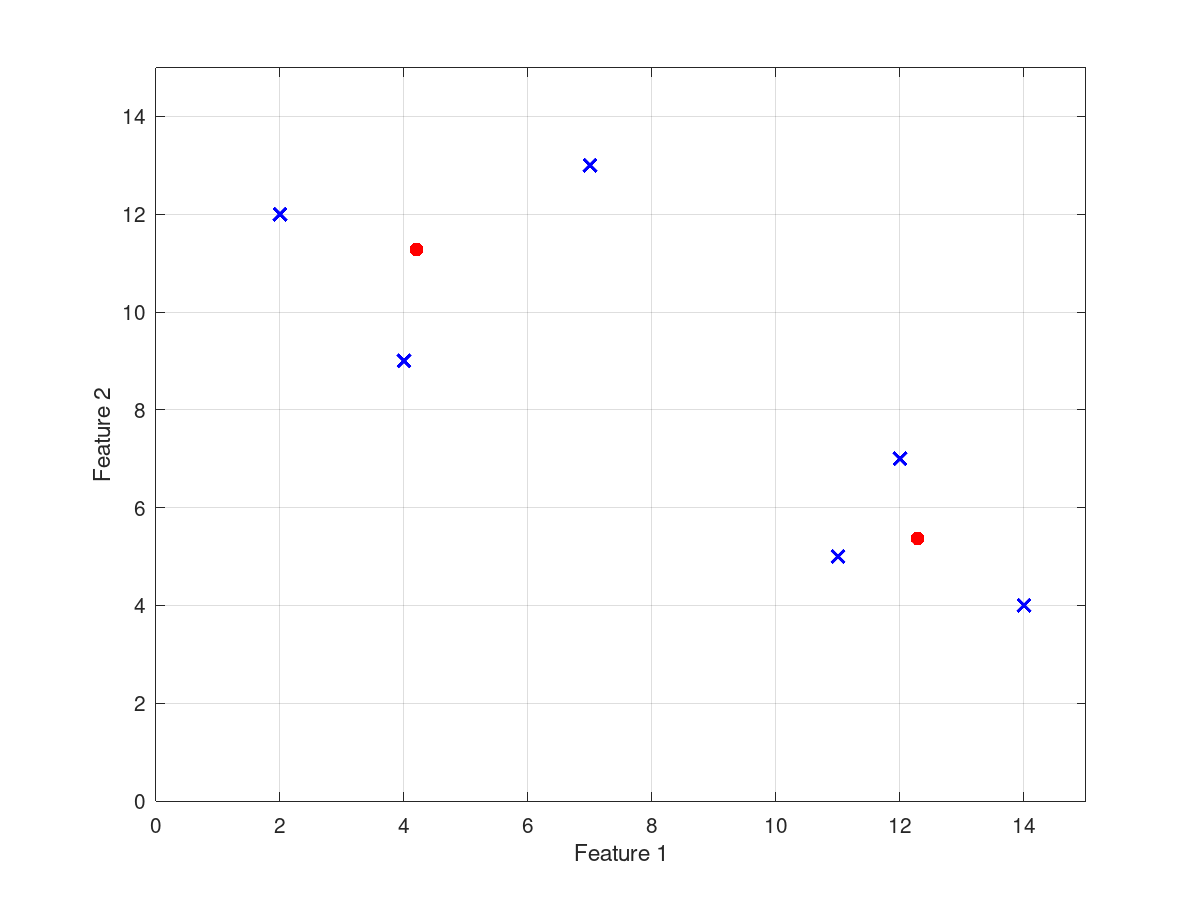
input_data = [2 12; 4 9; 7 13; 11 5; 12 7; 14 4];
number_of_clusters = 2;
[cluster_centers, soft_partition, obj_fcn_history] = ...
fcm (input_data, number_of_clusters)
## Plot the data points as small blue x's.
figure ('NumberTitle', 'off', 'Name', 'FCM Demo 1');
for i = 1 : rows (input_data)
plot (input_data(i, 1), input_data(i, 2), 'LineWidth', 2, ...
'marker', 'x', 'color', 'b');
hold on;
endfor
## Plot the cluster centers as larger red *'s.
for i = 1 : number_of_clusters
plot (cluster_centers(i, 1), cluster_centers(i, 2), ...
'LineWidth', 4, 'marker', '*', 'color', 'r');
hold on;
endfor
## Make the figure look a little better:
## - scale and label the axes
## - show gridlines
xlim ([0 15]);
ylim ([0 15]);
xlabel ('Feature 1');
ylabel ('Feature 2');
grid
hold
## Calculate and print the three validity measures.
printf ("Partition Coefficient: %f\n", ...
partition_coeff (soft_partition));
printf ("Partition Entropy (with a = 2): %f\n", ...
partition_entropy (soft_partition, 2));
printf ("Xie-Beni Index: %f\n\n", ...
xie_beni_index (input_data, cluster_centers, ...
soft_partition));
Produces the following output
Iteration count = 1,  Objective fcn = 90.853577
Iteration count = 2,  Objective fcn = 90.060620
Iteration count = 3,  Objective fcn = 86.674875
Iteration count = 4,  Objective fcn = 60.837149
Iteration count = 5,  Objective fcn = 30.336191
Iteration count = 6,  Objective fcn = 28.768663
Iteration count = 7,  Objective fcn = 28.757528
Iteration count = 8,  Objective fcn = 28.757461
Iteration count = 9,  Objective fcn = 28.757460
Iteration count = 10,  Objective fcn = 28.757460
Iteration count = 11,  Objective fcn = 28.757460
cluster_centers =

   12.2859    5.3691
    4.2023   11.2805

soft_partition =

   0.034600   0.060194   0.111226   0.979533   0.966514   0.968710
   0.965400   0.939806   0.888774   0.020467   0.033486   0.031290

obj_fcn_history =

 Columns 1 through 8:

   90.854   90.061   86.675   60.837   30.336   28.769   28.758   28.757

 Columns 9 through 11:

   28.757   28.757   28.757

Partition Coefficient: 0.909483
Partition Entropy (with a = 2): 0.267539
Xie-Beni Index: 0.095582
and the following figure
| Figure 1 |
|---|
 |
Demonstration 2
The following code
 ## This demo:
 ##    - classifies three-dimensional unlabeled data points using
 ##      the Fuzzy C-Means algorithm into three fuzzy clusters
 ##    - plots the input points together with the cluster centers
 ##    - evaluates the quality of the resulting clusters using
 ##      three validity measures: the partition coefficient, the
 ##      partition entropy, and the Xie-Beni validity index
 ##
 ## Note: The input_data was selected to form three areas of
 ##       different shapes.

 ## Use fcm to classify the input_data.
 input_data = [1 11 5; 1 12 6; 1 13 5; 2 11 7; 2 12 6; 2 13 7;
               3 11 6; 3 12 5; 3 13 7; 1 1 10; 1 3 9; 2 2 11;
               3 1 9; 3 3 10; 3 5 11; 4 4 9; 4 6 8; 5 5 8; 5 7 9;
               6 6 10; 9 10 12; 9 12 13; 9 13 14; 10 9 13; 10 13 12;
               11 10 14; 11 12 13; 12 6 12; 12 7 15; 12 9 15;
               14 6 14; 14 8 13];
 number_of_clusters = 3;
 [cluster_centers, soft_partition, obj_fcn_history] = ...
   fcm (input_data, number_of_clusters, [NaN NaN NaN 0])

 ## Plot the data points in two dimensions (using features 1 & 2)
 ## as small blue x's.
 figure ('NumberTitle', 'off', 'Name', 'FCM Demo 2');
 for i = 1 : rows (input_data)
   plot (input_data(i, 1), input_data(i, 2), 'LineWidth', 2, ...
         'marker', 'x', 'color', 'b');
   hold on;
 endfor

 ## Plot the cluster centers in two dimensions
 ## (using features 1 & 2) as larger red *'s.
 for i = 1 : number_of_clusters
   plot (cluster_centers(i, 1), cluster_centers(i, 2), ...
         'LineWidth', 4, 'marker', '*', 'color', 'r');
   hold on;
 endfor

 ## Make the figure look a little better:
 ##    - scale and label the axes
 ##    - show gridlines
 xlim ([0 15]);
 ylim ([0 15]);
 xlabel ('Feature 1');
 ylabel ('Feature 2');
 grid
 hold

 ## Plot the data points in two dimensions
 ## (using features 1 & 3) as small blue x's.
 figure ('NumberTitle', 'off', 'Name', 'FCM Demo 2');
 for i = 1 : rows (input_data)
   plot (input_data(i, 1), input_data(i, 3), 'LineWidth', 2, ...
         'marker', 'x', 'color', 'b');
   hold on;
 endfor

 ## Plot the cluster centers in two dimensions
 ## (using features 1 & 3) as larger red *'s.
 for i = 1 : number_of_clusters
   plot (cluster_centers(i, 1), cluster_centers(i, 3), ...
         'LineWidth', 4, 'marker', '*', 'color', 'r');
   hold on;
 endfor

 ## Make the figure look a little better:
 ##    - scale and label the axes
 ##    - show gridlines
 xlim ([0 15]);
 ylim ([0 15]);
 xlabel ('Feature 1');
 ylabel ('Feature 3');
 grid
 hold

 ## Calculate and print the three validity measures.
 printf ("Partition Coefficient: %f\n", ...
         partition_coeff (soft_partition));
 printf ("Partition Entropy (with a = 2): %f\n", ...
         partition_entropy (soft_partition, 2));
 printf ("Xie-Beni Index: %f\n\n", ...
         xie_beni_index (input_data, cluster_centers, ...
         soft_partition));
Produces the following output
cluster_centers =

    2.0937   11.9016    6.0942
   11.0424    9.5332   13.3569
    3.1989    3.6231    9.5521

soft_partition =

 Columns 1 through 6:

   0.94460624   0.97904349   0.95108802   0.96196795   0.99948302   0.96487459
   0.01752318   0.00738409   0.01874023   0.01270522   0.00019250   0.01463766
   0.03787058   0.01357242   0.03017175   0.02532683   0.00032448   0.02048775

 Columns 7 through 12:

   0.96331614   0.96456842   0.94834221   0.07642432   0.05674249   0.04620204
   0.01308599   0.01391531   0.02306631   0.05591114   0.03103187   0.03916203
   0.02359787   0.02151627   0.02859148   0.86766454   0.91222565   0.91463593

 Columns 13 through 18:

   0.05115244   0.00651697   0.05054179   0.01424379   0.15867529   0.10409548
   0.04187871   0.00523606   0.04037319   0.01069963   0.07358160   0.07247933
   0.90696885   0.98824698   0.90908503   0.97505659   0.76774311   0.82342519

 Columns 19 through 24:

   0.22740701   0.14085225   0.06286410   0.09081464   0.11767870   0.01226481
   0.15029072   0.18715138   0.86966723   0.83431507   0.78958055   0.97102320
   0.62230227   0.67199637   0.06746867   0.07487029   0.09274075   0.01671199

 Columns 25 through 30:

   0.12048277   0.00431336   0.04478439   0.07196388   0.04390084   0.01999625
   0.79477187   0.99051510   0.91541198   0.79247547   0.88148555   0.95268541
   0.08474537   0.00517154   0.03980363   0.13556065   0.07461361   0.02731834

 Columns 31 and 32:

   0.07283953   0.04849994
   0.80460161   0.88429598
   0.12255886   0.06720408

obj_fcn_history =

 Columns 1 through 8:

   428.77   319.46   208.11   182.33   180.83   180.64   180.61   180.61

 Columns 9 through 16:

   180.61   180.61   180.61   180.61   180.61   180.61   180.61   180.61

 Column 17:

   180.61

Partition Coefficient: 0.813224
Partition Entropy (with a = 2): 0.541401
Xie-Beni Index: 0.207217
and the following figures
| Figure 1 | Figure 2 |
|---|---|
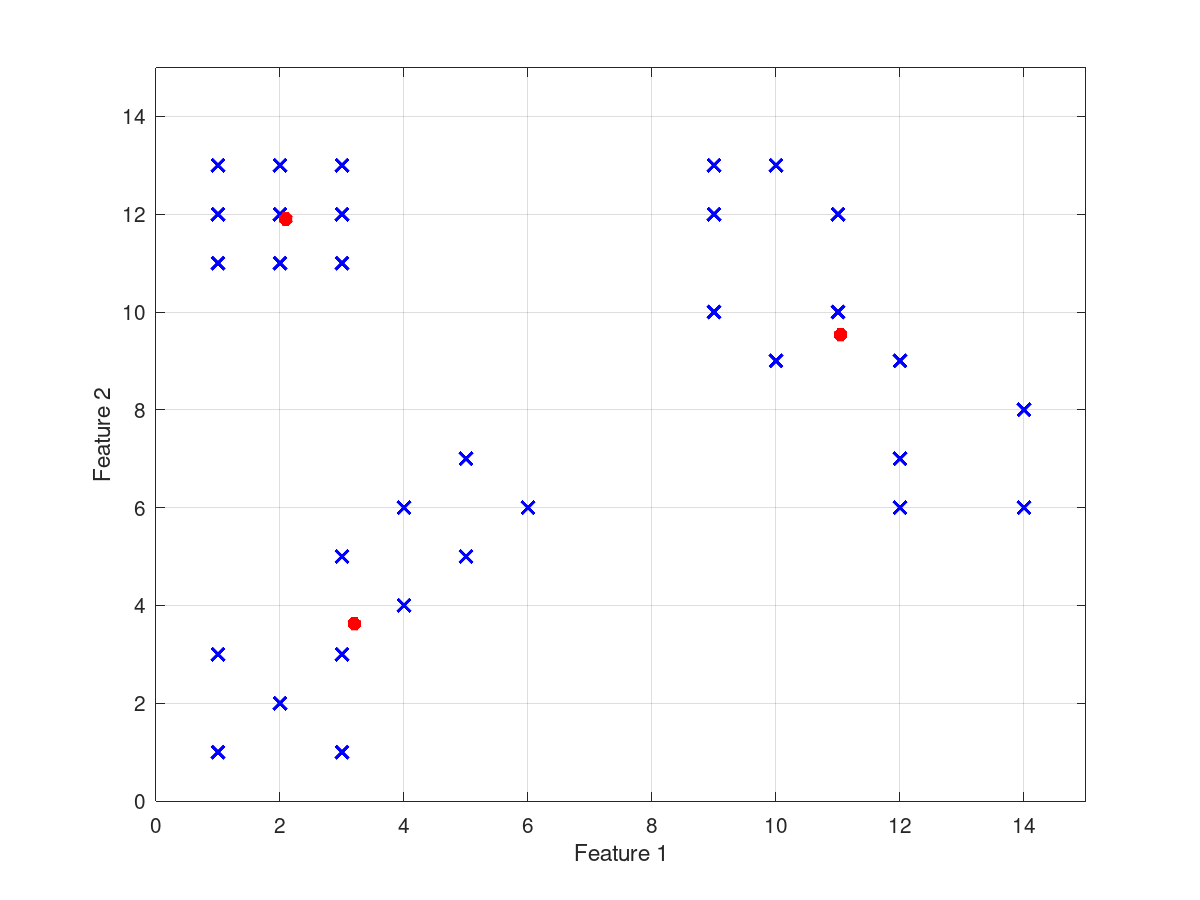 |
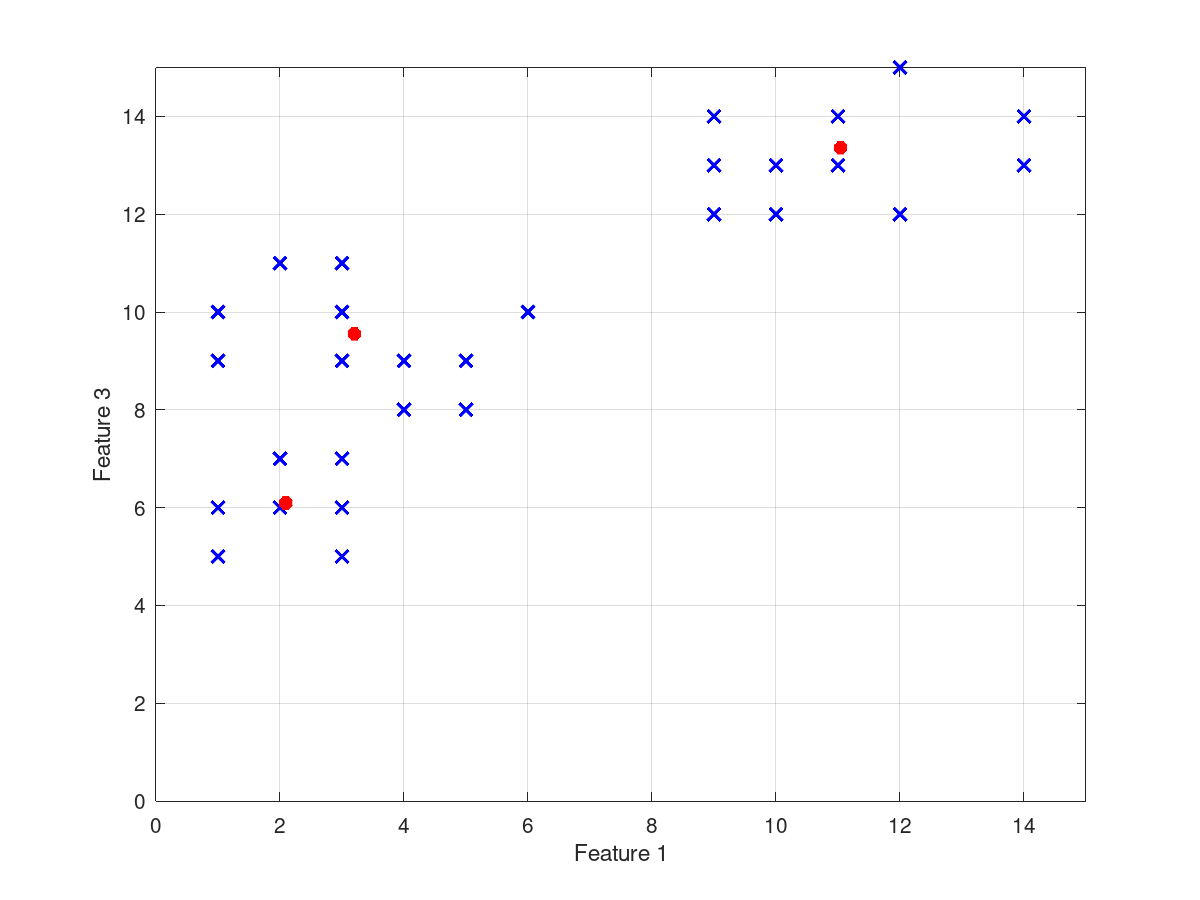 |
Package: fuzzy-logic-toolkit