- Function: drawFilledPolygon (p)
- Function: drawFilledPolygon (hax, p)
- Function: clipPolygon (…, prop, value, …)
- Function: h = drawFilledPolygon (…)
Draw a filled polygon.
Add a patch representing the polygon(s) p in the current axes.
Multiple property-value pairs may be specified, but they must appear in pairs. These arguments are passed to the function
patch.If the first argument hax is an axes handle, then plot into this axes, rather than the current axes returned by
gca.If p is a cell, each element of the cell is processed in sequence.
The optional return value h is a vector of graphics handles to the created patch objects.
For example:
Draw a polygon with default filling color and red edges.
pol = [1 2; 7 4; 4 7; 1 2; NaN NaN; 2.5 3; 5.5 4; 4 5.5; 2.5 3];
h = drawFilledPolygon (pol, 'edgecolor', 'r');
See also: drawPolygon, polygon2patch, patch.
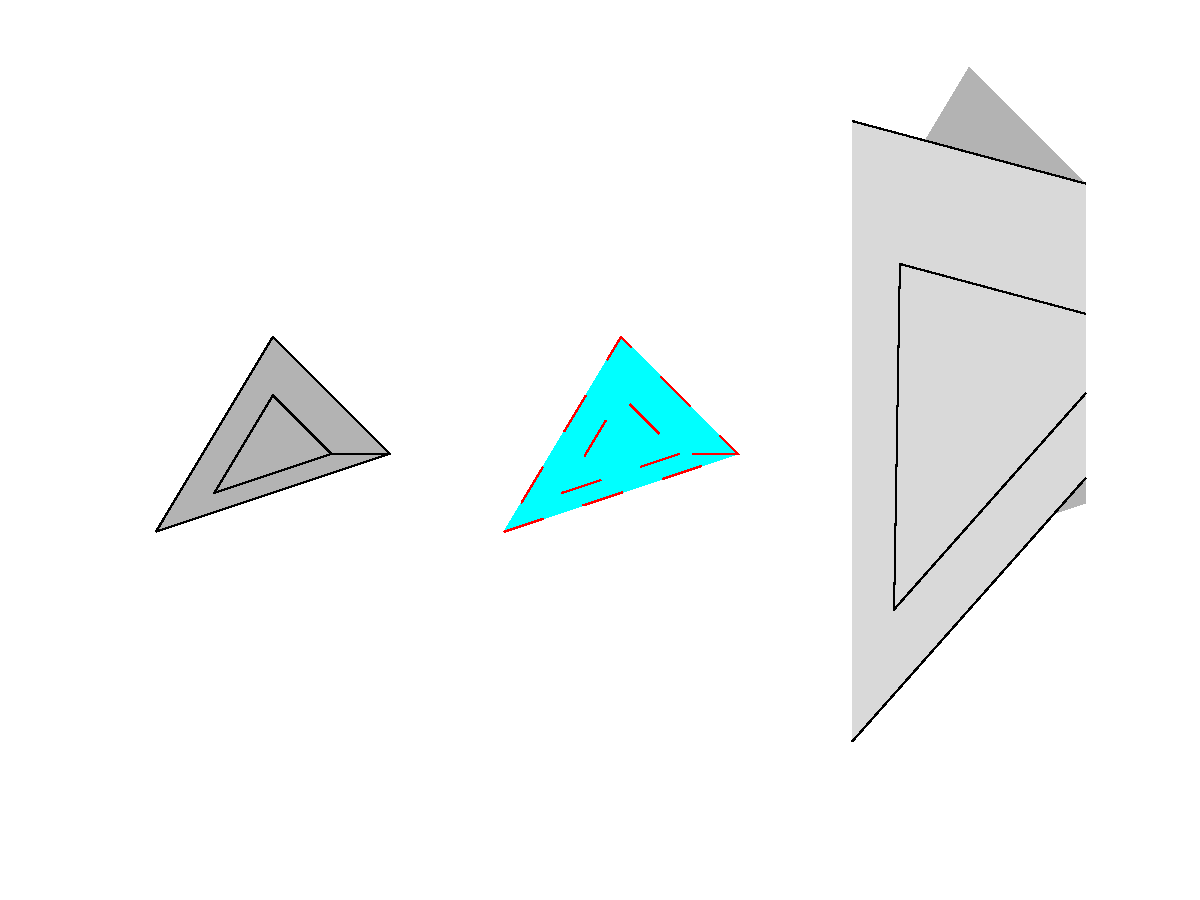
Demonstration 1
The following code
 figure (1)
 clf;
 pol = [1 2; 7 4; 4 7; 1 2; NaN NaN; 2.5 3; 5.5 4; 4 5.5; 2.5 3];
 subplot(131)
 drawFilledPolygon(pol)
 axis tight equal off
 subplot(132)
 drawFilledPolygon(pol, 'facecolor', 'c', 'linestyle', '--', 'edgecolor', 'r')
 axis tight equal off
 subplot(133)
 R = createRotation (polygonCentroid (splitPolygons(pol){1}), pi/6);
 pol2 =  transformPoint (pol, R);
 drawFilledPolygon(pol, 'linestyle', 'none')
 drawFilledPolygon(gca, pol2, 'facealpha', 0.5)
 axis tight equal off
Produces the following figure
| Figure 1 |
|---|
 |
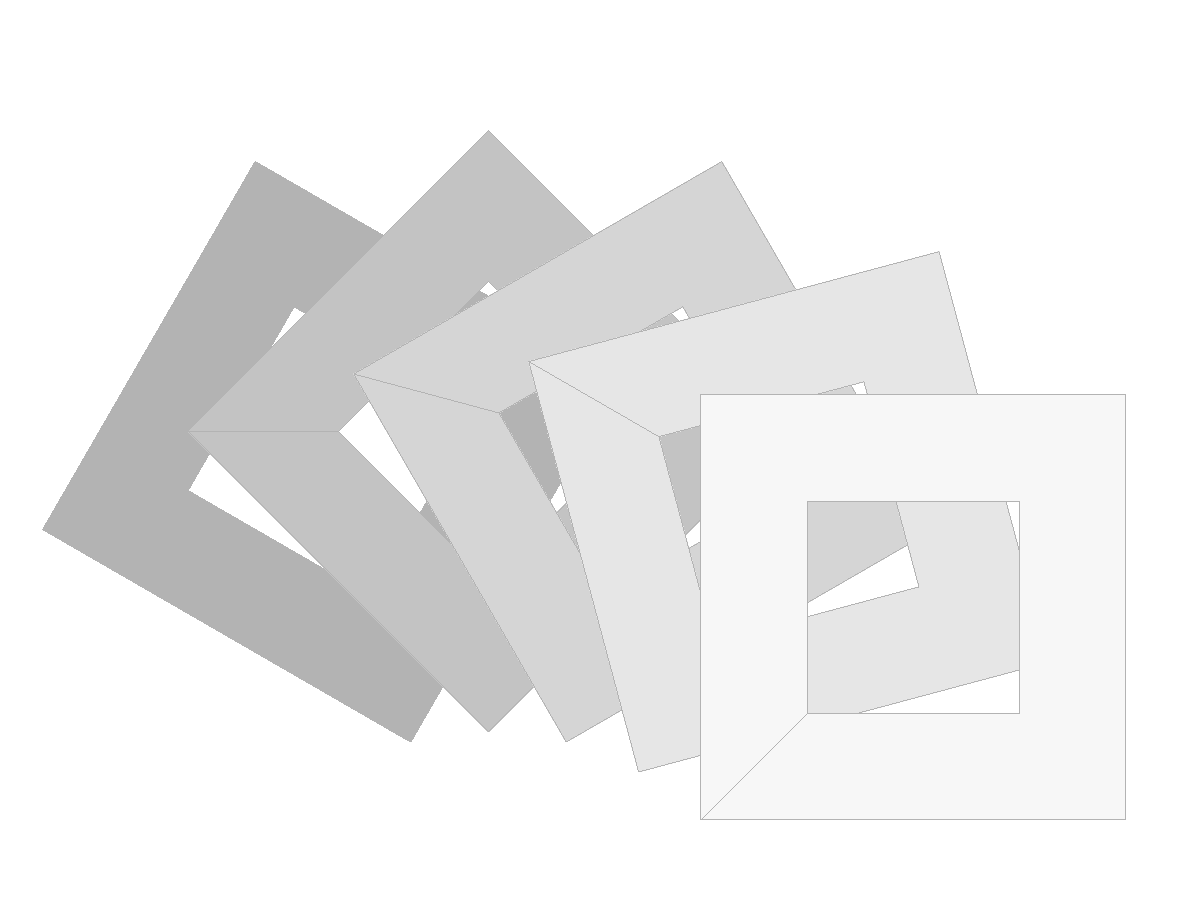
Demonstration 2
The following code
 pol   = [2 2; 6 2; 6 6; 2 6; 2 2; NaN NaN; 3 3; 3 5; 5 5; 5 3; 3 3];
 n     = 5;
 alpha = linspace(0.1, 1, n);
 theta = linspace(pi / 3, 0, n);

 cpol = cell(n, 1);
 for i = 1:n
  cpol{i} = transformPoint (pol, createRotation (theta(i)));
 endfor
 h = drawFilledPolygon(cpol, 'linestyle', 'none');
 for i = 1:n-1
  set(h(i), 'facealpha', alpha(i))
 endfor
 axis tight equal off
Produces the following figure
| Figure 1 |
|---|
 |
Package: geometry