- Function: h = plotShape (shape)
- Function: h = plotShape (…, 'tol', value)
- Function: h = plotShape (…, prop, value)
Plots a 2D shape defined by piecewise smooth polynomials in the current axis.
shape is a cell where each elements is a 2-by-(poly_degree+1) matrix containing a pair of polynomials.
The property ’Tol’ sets the tolerance for the quality of the polygon as explained in
shape2polygon. Additional property value pairs are passed todrawPolygon.See also: drawPolygon, shape2polygon, polygon2shape.
Demonstration 1
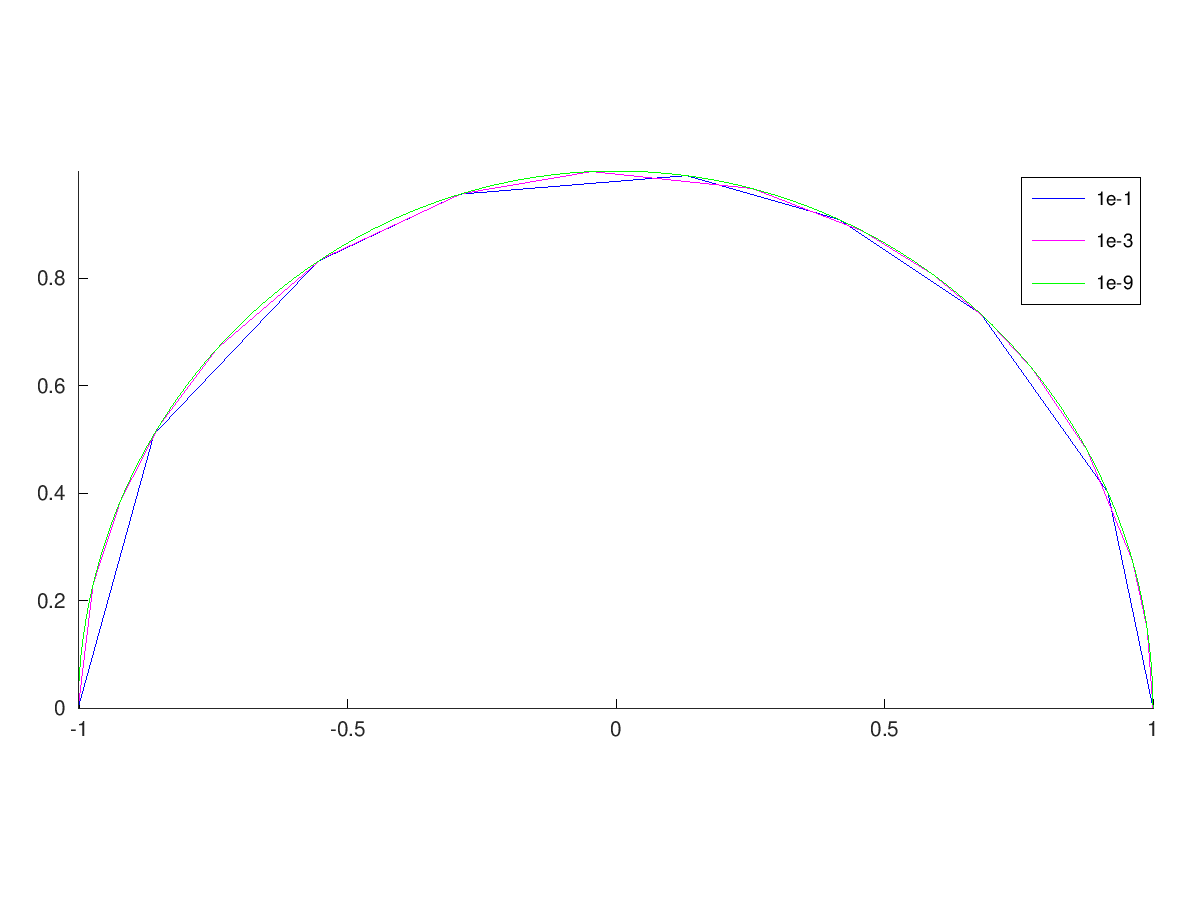
The following code
 # Taylor series of cos(pi*x),sin(pi*x)
 n = 5; N = 0:5;
 s{1}(1,2:2:2*n+2) = fliplr ( (-1).^N .* (pi).^(2*N) ./ factorial (2*N));
 s{1}(2,1:2:2*n+1) = fliplr ( (-1).^N .* (pi).^(2*N+1) ./ factorial (2*N+1));

 h(1) = plotShape (s, 'tol', 1e-1, 'color','b');
 h(2) = plotShape (s, 'tol', 1e-3, 'color', 'm');
 h(3) = plotShape (s, 'tol', 1e-9, 'color', 'g');
 legend (h, {'1e-1','1e-3','1e-9'})
 axis image
Produces the following figure
| Figure 1 |
|---|
 |
Package: geometry