- : XYo = polygon2patch (XYi)
- : [Xo, Yo ] = polygon2patch (Xi, Yi)
- : [Xo, Yo, Zo ] = polygon2patch (Xi, Yi, Zi)
Connect outer (filled) polygon and inner (hole) polygons using branch cuts such that all polygons are connected as one string of vertices, for subsequent plotting polygons with holes using the function
patch.XYi can be a 2 or 3 dimensional array; only the X and Y coordinates will be optmized and Z-values will be kept with their original vertices. Alternatively separate X, Y and optionally Z-vectors can be specified. The outer polygon should appear as a first subvector, bounded by a row of NaN values, and have a counterclockwise winding direction. All subsequent inner hole polygons should also be bounded by rows of NaN values and have clockwise winding directions.
This function expects and returns column vectors or matrices where each row contains coordinates of a vertex.
See also: drawPolygon, patch.
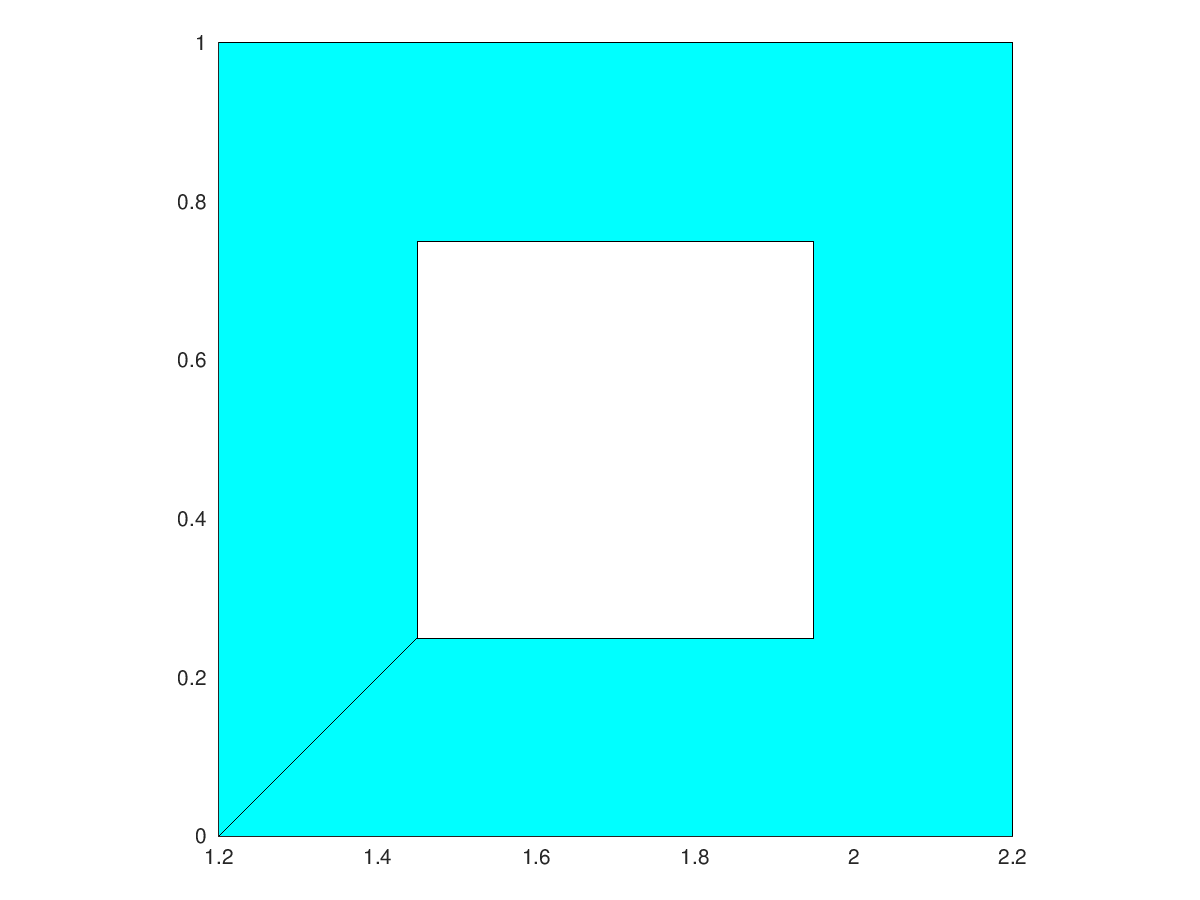
Demonstration 1
The following code
 figure()
 p  = [0 0; 0 1; 1 1; 1 0]; %ccw
 pp = [0 0; 1 0; 1 1; 0 1]; %cw
 ph = p + [1.2 0];
 # add hole
 ph(end+1,:) = nan;
 ph          = [ph; (pp-[0.5 0.5])*0.5+[1.7 0.5]];
 po = polygon2patch (ph);
 patch (po(:,1), po(:,2), 'b', 'facecolor', 'c');
 axis image
Produces the following figure
| Figure 1 |
|---|
 |
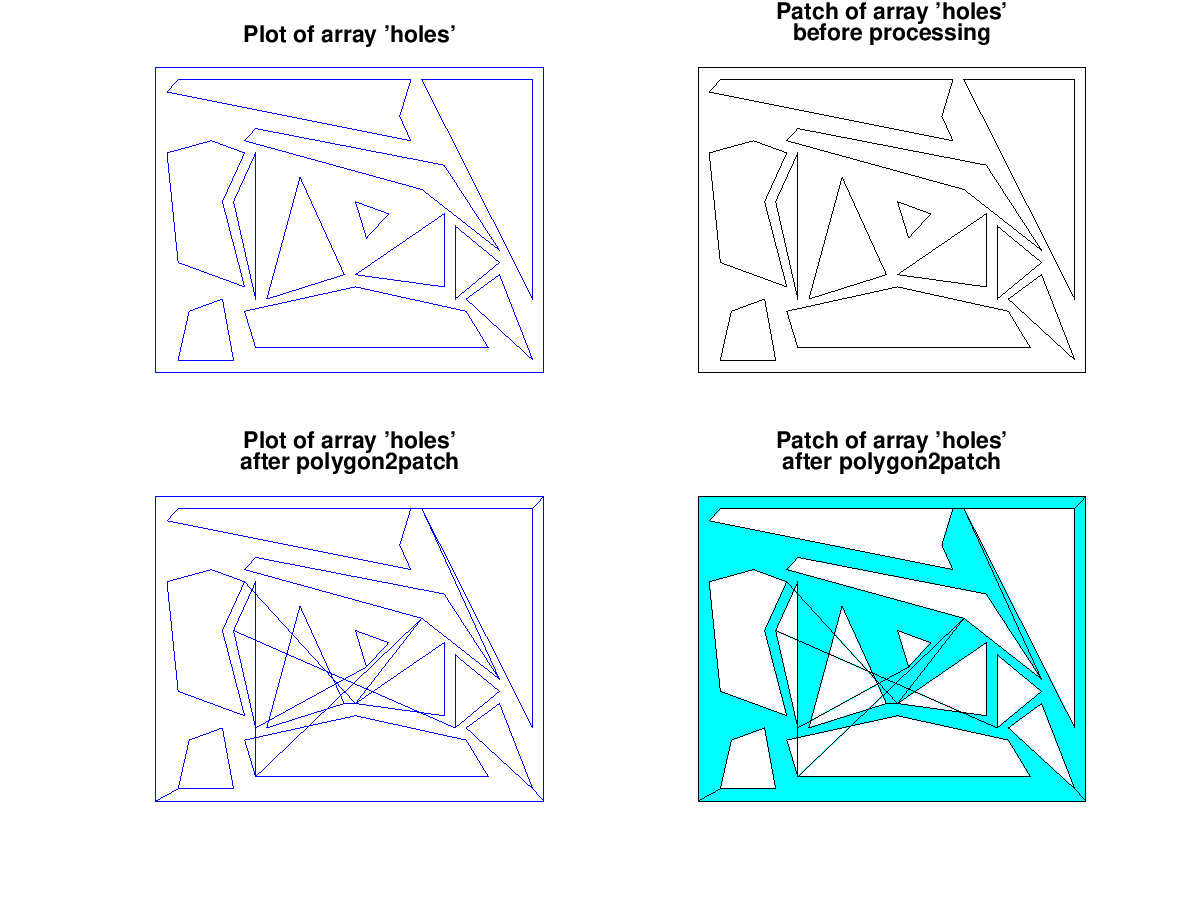
Demonstration 2
The following code
 holes = [0 0; 35 0; 35 25; 0 25; 0 0; NaN NaN; 7 1; 2 1; 3 5; 6 6; 7 1; ...
 NaN NaN; 9 2; 8 5; 18 7; 28 5; 30 2; 9 2; NaN NaN; 19 11; 18 14; 21 13; ...
 19 11; NaN NaN; 24 24; 34 24; 34 6; 24 24; NaN NaN; 9 6; 7 14; 9 18; 9 6; ...
 NaN NaN; 27 6; 27 12; 31 9; 27 6; NaN NaN; 2 24; 23 24; 22 21; 23 19; ...
 1 23; 2 24; NaN NaN; 18 8; 26 13; 26 7; 18 8; NaN NaN; 8 18; 6 14; 8 7; ...
 2 9; 1 18; 5 19; 8 18; NaN NaN; 13 16; 17 8; 10 6; 13 16; NaN NaN; 34 1; ...
 28 6; 31 8; 34 1; NaN NaN; 9 20; 26 17; 31 10; 24 15; 8 19; 9 20];
 subplot (2, 2, 1);
 p1 = plot (holes(:, 1), holes(:, 2), 'b'); box off; axis off
 title ("Plot of array 'holes'");
 subplot (2, 2, 2);
 p2 = patch (holes(:, 1), holes(:, 2), 'b', 'facecolor', 'c'); box off; axis off
 title ("Patch of array 'holes'\nbefore processing");
 subplot (2, 2, 3);
 pt = polygon2patch (holes);
 p3 = plot (pt(:, 1), pt(:, 2), 'b'); box off; axis off
 title ("Plot of array 'holes'\nafter polygon2patch");
 subplot (2, 2, 4);
 p4 = patch (pt(:, 1), pt(:, 2), 'b', 'facecolor', 'c'); box off; axis off
 title ("Patch of array 'holes'\nafter polygon2patch");
Produces the following figure
| Figure 1 |
|---|
 |
Package: geometry