- Function File: lines = houghlines (BW, theta, rho, peaks) 
- Function File: lines = houghlines (…, property, value, …) 
Extract line segments from a Hough transform.
This function takes as inputs the binary 2D image BW and the vectors theta and rho with the coodinates of the Hough transform (as returned by the
houghfunction). Its peaks input is an n-by-2 array where each row contains the coodinates of a peak of interest in the Hough transform. (Those peaks in the Hough transform can be found with thehoughpeaksfunction.)The result lines of this function contains information about all the line segments in the image BW that correspond to the given peak positions of the Hough transform. The lines output is a struct array where each of the elements has the following four components to describe a single line segment:
point1has the xy-coordinates of the first pixel,point2the xy-coordinates of the last pixel,thetaits angle to the vertical axis andrhoits distance to the image origin. (output coordinate convention: [x, y] = [column, row])Additionally the following optional property-value-pairs can be used:
- FillGap
Gaps between line segments that are shorter or equal than FillGap will be ignored and both sides will still be considered as part of the same line segment. This value defaults to 20.
- MinLength
Line segments that are shorter than MinLength will be suppressed in the output. This value defaults to 40.
See also: hough, houghpeaks.
Demonstration 1
The following code
I = checkerboard (30, 1, 1);
I = imnoise(I, "salt & pepper", 0.2);
figure, imshow (I);
title ("noisy image with some lines");
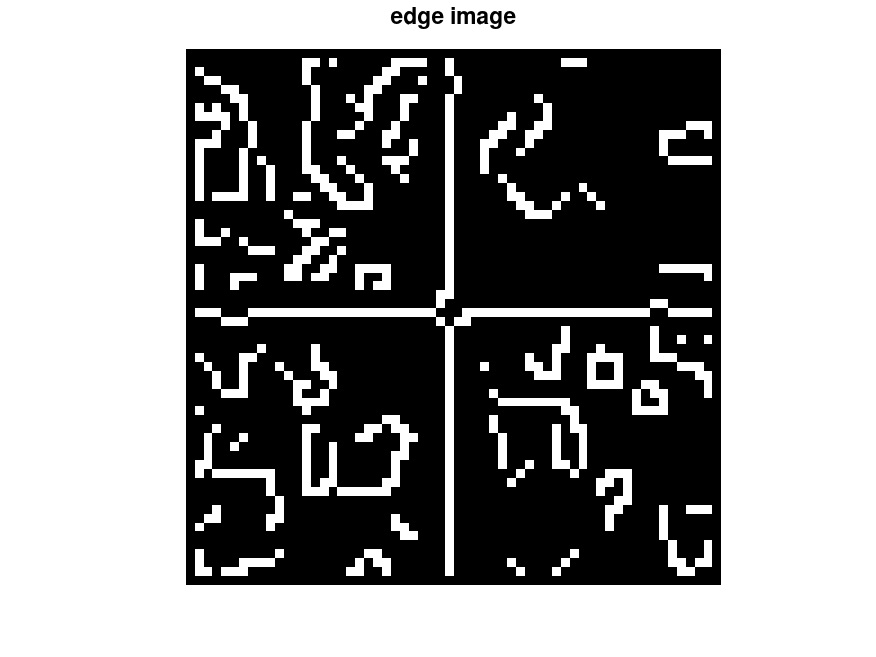
BW = edge (I, "canny");
figure, imshow(BW);
title ("edge image");
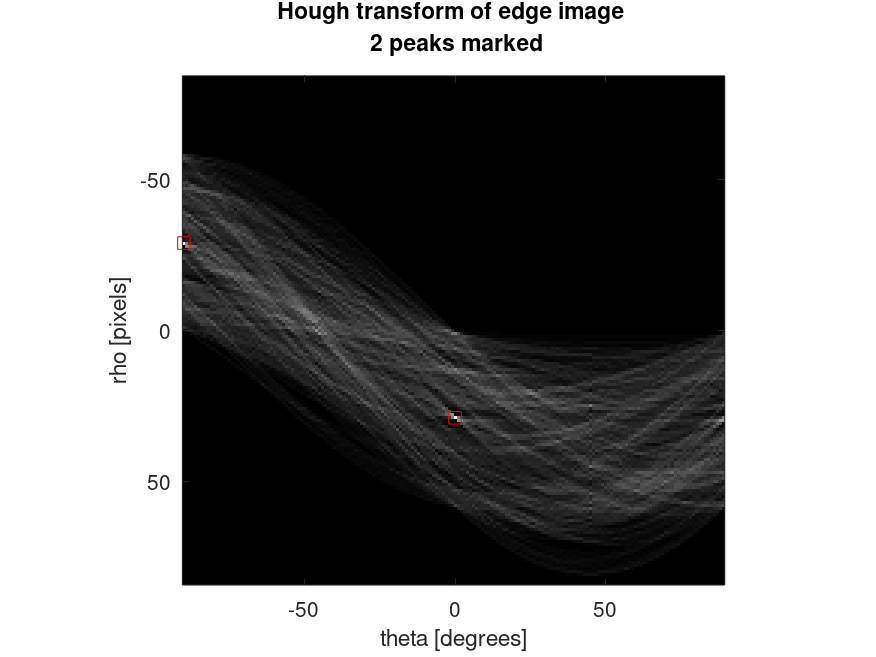
[H, theta, rho] = hough (BW);
figure, imshow (mat2gray (H), [], "XData", theta, "YData", rho);
title ("Hough transform of edge image \n 2 peaks marked");
axis on; xlabel("theta [degrees]"); ylabel("rho [pixels]");
peaks = houghpeaks (H, 2);
peaks_rho = rho(peaks(:,1));
peaks_theta = theta(peaks(:,2));
hold on; plot (peaks_theta, peaks_rho, "sr"); hold off;
lines = houghlines (BW, theta, rho, peaks);
figure, imshow (I), hold on;
for n = 1:length (lines)
points = [lines(n).point1; lines(n).point2];
plot (points(:,1), points(:,2), "r");
endfor
title ("the two strongest lines (edges) in the image"), hold off;
Produces the following figures
| Figure 1 | Figure 2 | Figure 3 | Figure 4 |
|---|---|---|---|
 |
 |
 |
 |
Package: image