- Function File: peaks = houghpeaks (H) 
- Function File: peaks = houghpeaks (H, numpeaks) 
- Function File: peaks = houghpeaks (H, …, property, value, …) 
Find peaks in a Hough transform.
The houghpeaks function finds positions of maximum value ("peaks") in the 2D matrix H of a Hough (line) transform. This hough transform H will normally come from the function hough. Its rows are distance coordinates (rho) of lines in an image, and its columns are angle coordinates (theta).
The output peaks of the houghpeaks functions is a n-by-2 matrix where each line is an x (rho) and y (theta) coordinate of a found peak, sorted in descending order of the corresponding peak value.
The number of returned peak coordinates can be limited with the numpeaks parameter, it defaults to 1.
Additionally the following optional property-value-pairs can be used:
- Threshold
Maximum positions in H with a value below this threshold will not counted as peaks. This defaults to 50% of the maximum value in H.
- NHoodSize
After finding one peak, a neighborhood of this size will be excluded from the search for further peaks. This parameter must be given as a two-element row vector. The first entry is the full width of the x (rho) neighborhood, the second entry of y (theta). Both numbers need to be odd integers. This defaults to the smallest odd number equal or bigger than size(H)/50.
See also: hough.
Demonstration 1
The following code
 I = checkerboard (30, 1, 1);
 I = imnoise(I, "salt & pepper", 0.2);
 figure, imshow (I);
 title ("noisy image with some lines");
 BW = edge (I, "canny");
 figure, imshow(BW);
 title ("edge image");
 [H, theta, rho] = hough (BW);
 figure, imshow (mat2gray (H), [],"XData",theta,"YData",rho);
 title ("Hough transform of edge image \n 2 peaks marked");
 axis on; xlabel("theta [degrees]"); ylabel("rho [pixels]");
 peaks = houghpeaks (H, 2);
 peaks_rho = rho(peaks(:,1))
 peaks_theta = theta(peaks(:,2))
 hold on;
 plot(peaks_theta,peaks_rho,"sr");
 hold off;
Produces the following output
peaks_rho =

   29  -29

peaks_theta =

    0  -90
and the following figures
| Figure 1 | Figure 2 | Figure 3 |
|---|---|---|
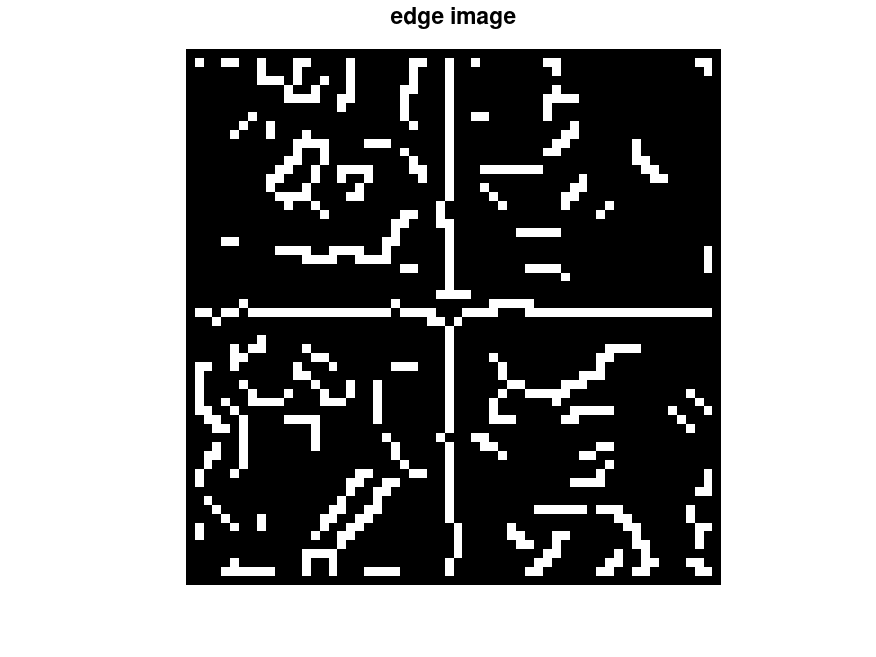 |
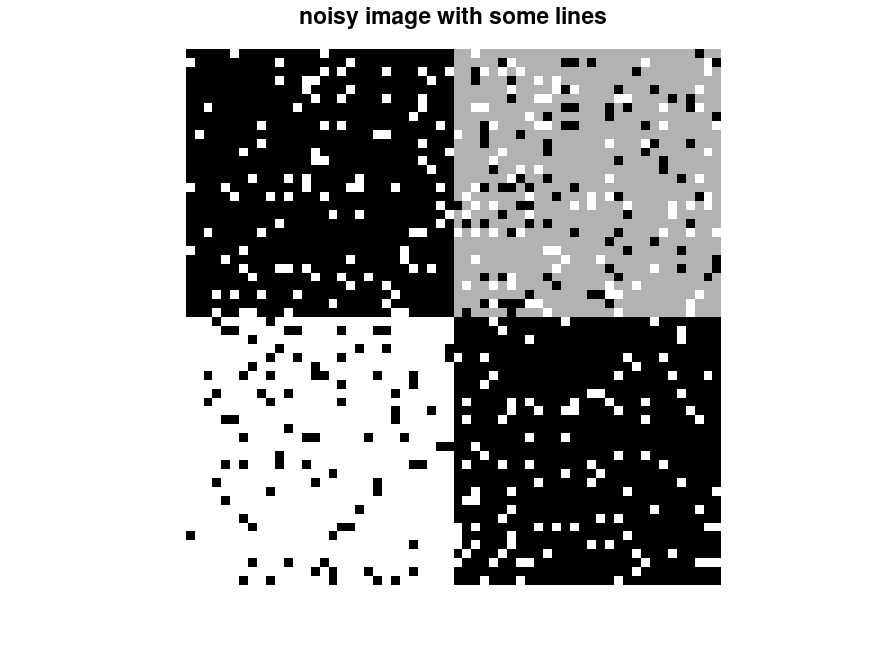 |
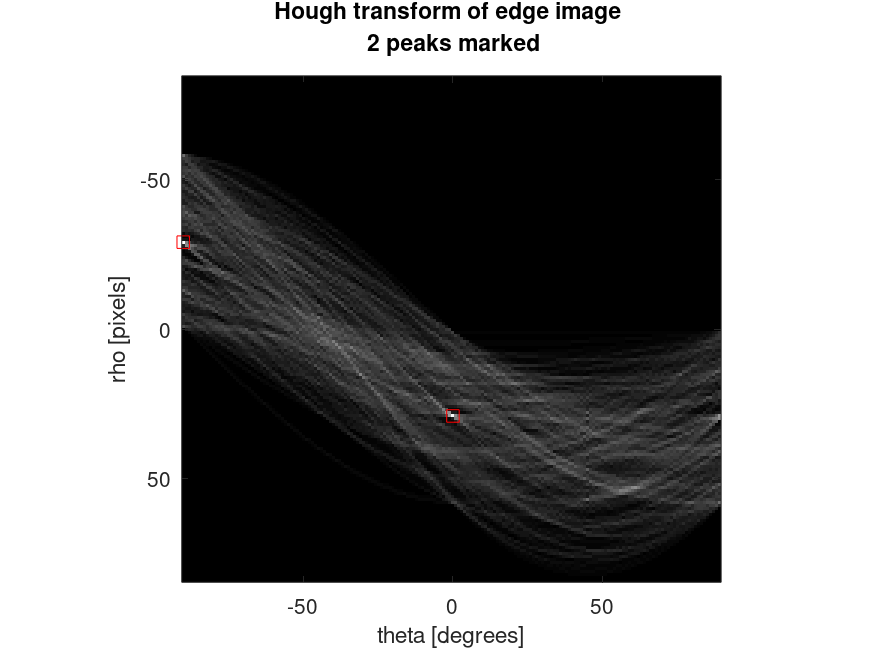 |
Package: image