- Function File: viscircles (centers, radii) 
- Function File: viscircles (hax, centers, radii) 
- Function File: viscircles (…, property, value) 
- Function File: h = viscircles (…) 
Draw circles on figure.
Circles are specified by a Nx2 matrix centers with x,y coordinates per row, and a N length vector radii.
## draw circles at [10 20] and [-10 -20] coordinates
## with radius of 10 and 20 respectively
viscircles ([10 20; -10 -20], [10 20])
The appearance of the drawn circles can be configured with the following properties names:
"Color"The color of the circle. Defaults to
"red". Can be defined via the color names or RGB triplets. See the help text forplotfor further details on specifying colors in figures."LineStyle"-
The line style of the circle. Defaults to
"-"(solid line). See the help text forplotfor possible values. "LineWidth"The width of the circle line. Defaults to 2.
"EnhanceVisibility"Enhance visibility by drawing a white circle under the colored circle. Must be a logical value. Defaults to true.
See also: plot, line.
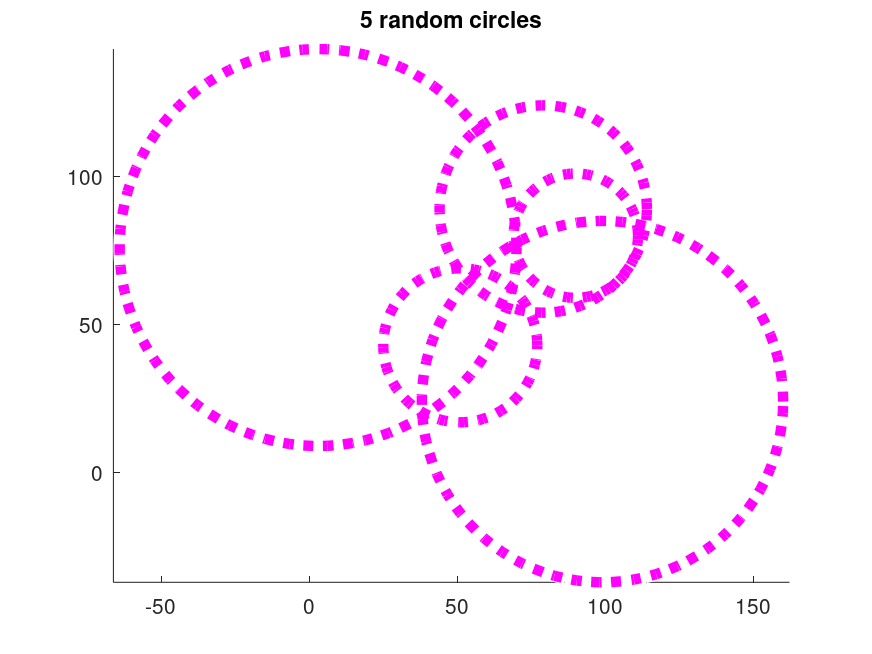
Demonstration 1
The following code
 centers = randi ([0 100], 5, 2);
 radii = randi ([10 100], 5, 1);
 axis equal
 viscircles (centers, radii,
             "Color", "magenta",
             "LineStyle", ":",
             "LineWidth", 5);
 title ("5 random circles");
 #----------------------------------------------
 # the figure window shows 5 circles with random
 # radii and positions
Produces the following figure
| Figure 1 |
|---|
 |
Package: image