- Method on
@infsup: plot (X, Y) ¶ - Method on
@infsup: plot (Y) ¶ - Method on
@infsup: plot (X, Y, COLOR) ¶ - Method on
@infsup: plot (X, Y, COLOR, EDGECOLOR) ¶ -
Create a 2D-plot of intervals.
If either of X or Y is an empty interval, nothing is plotted. If both X and Y are singleton intervals, a single point is plotted. If only one of X and Y is a singleton interval, a single line is plotted. If neither of X and Y is a singleton interval, a filled rectangle is plotted.
If X or Y are arrays, each pair of elements is plotted separately. No connection of the interval areas is plotted, because that kind of interpolation would be wrong in general (in the sense that the actual values are enclosed by the plot).
Without parameter X, the intervals in Y are plotted as points or lines, which are parallel to the y axis, at the coordinates
X = [1, …, n].If no COLOR is given, the current
colormapis used. Use COLOR = none to disable plotting of filled rectangles. If an optional parameter EDGECOLOR is given, rectangles will have visible edges in a distinct color.
Demonstration 1
The following code
  clf
  hold on
  plot (infsup (0), infsup (0));
  plot (infsup (1, 2), infsup (0));
  plot (infsup (0), infsup (1, 2));
  plot (infsup (1, 2), infsup (1, 2));
  axis ([-.5, 2.5, -.5, 2.5]);
  hold off
Produces the following figure
| Figure 1 |
|---|
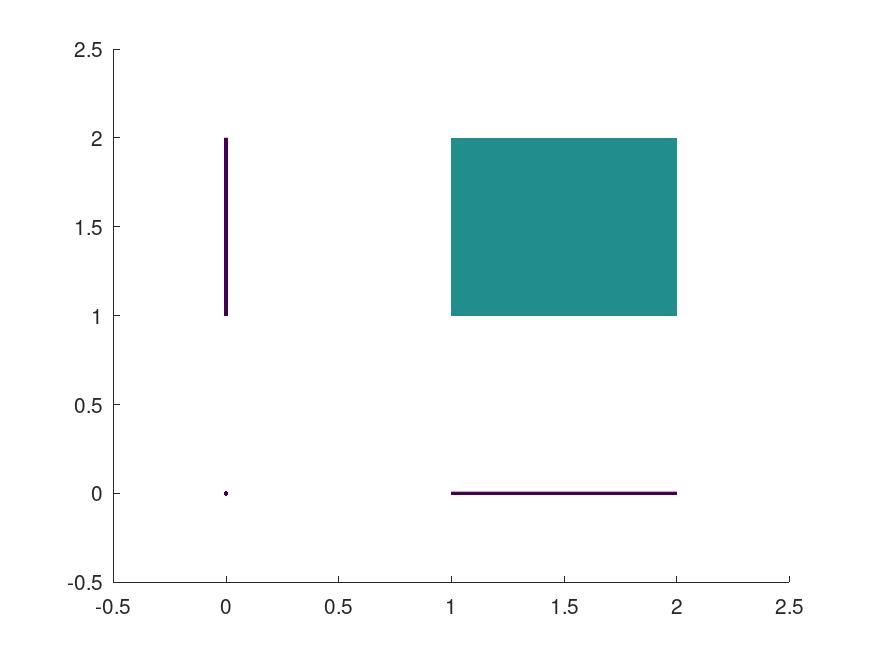 |
Demonstration 2
The following code
  clf
  plot (infsup (-rand (50, 1), +rand (50, 1)));
Produces the following figure
| Figure 1 |
|---|
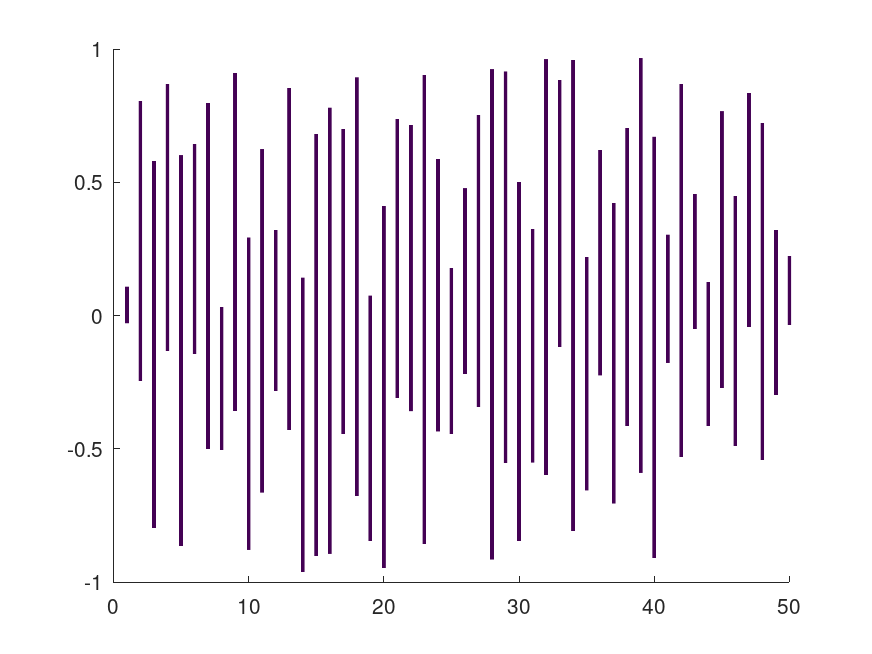 |
Demonstration 3
The following code
  clf
  hold on
  axis off
  range = infsup (0, 9);
  x = linspace (inf (range), sup (range), 250);
  X = mince (range, 9);
  f = @ (x) 0.5 * sin (x) .* x .^ 2;
  y = f (x);
  Y = f (X);
  plot (range, f (range), [42 161 152]/255);
  plot (X, Y, [238 232 213]/255, [88 110 117]/255);
  plot (x, y, '-', 'color', [220 50 47]/255, 'linewidth', 2);
  hold off
Produces the following figure
| Figure 1 |
|---|
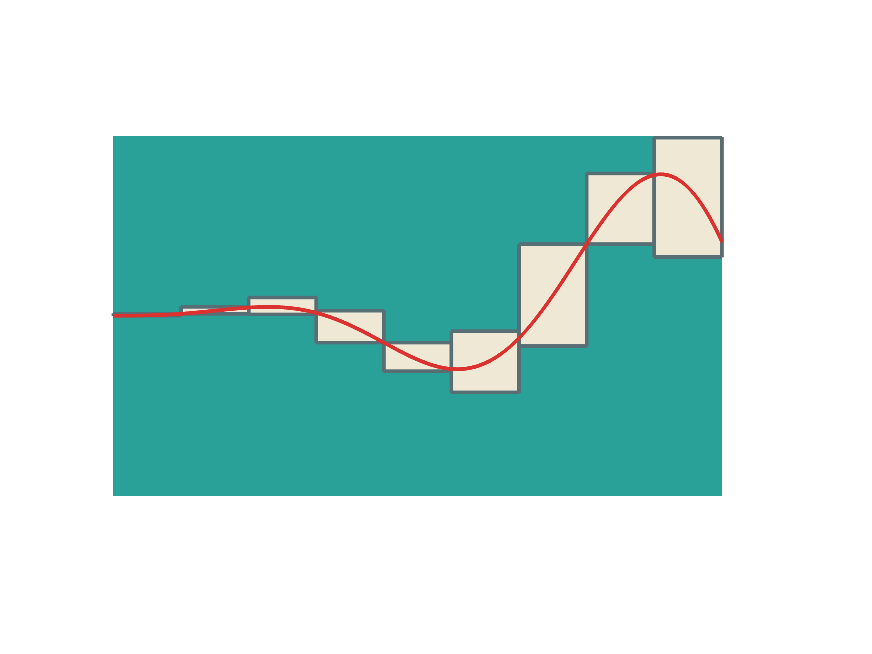 |
Package: interval