- Method on
@infsup: plot3 (X, Y, Z) ¶ - Method on
@infsup: plot3 (X, Y, Z, COLOR) ¶ - Method on
@infsup: plot3 (X, Y, Z, COLOR, EDGECOLOR) ¶ -
Create a 3D-plot of intervals.
If either of X, Y or Z is an empty interval, nothing is plotted. If all are singleton intervals, a single point is plotted. If two intervals are a singleton interval, a line is plotted. If one interval is a singleton interval, a rectangle is plotted. If neither of X, Y and Z is a singleton interval, a cuboid is plotted.
When interval arrays of equal size are given, each triple of elements is printed separately.
No connection of the interval areas is plotted, because that kind of interpolation would be wrong in general (in the sense that the actual values are enclosed by the plot).
If no COLOR is given, the current
colormapis used. Use COLOR = none to disable plotting of filled rectangles. If an optional parameter EDGECOLOR is given, rectangles and cuboids will have visible edges in a distinct color.
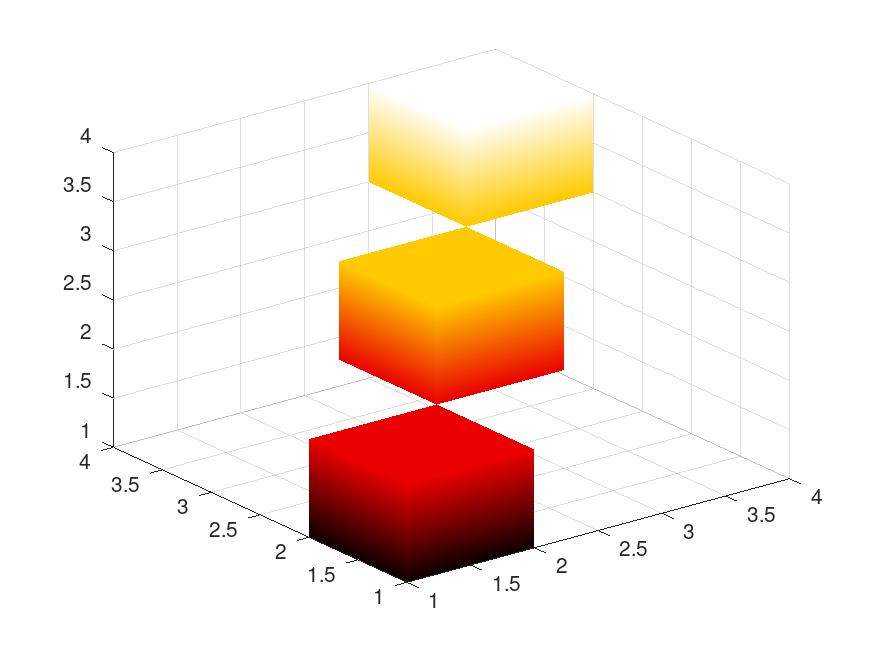
Demonstration 1
The following code
  clf
  colormap hot
  x = y = z = (1 : 3) + infsup ("[0, 1]");
  plot3 (x, y, z);
  grid on
Produces the following figure
| Figure 1 |
|---|
 |
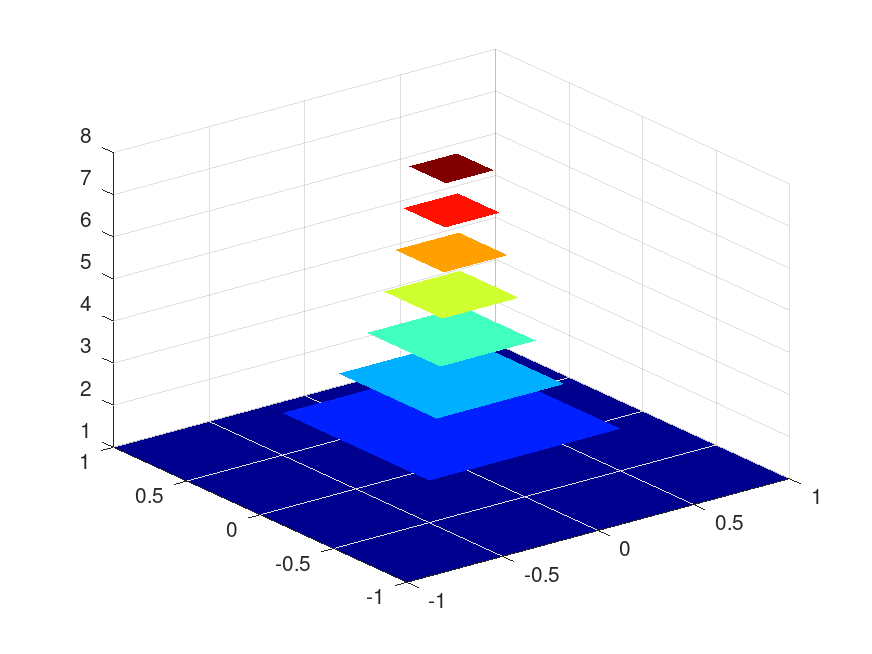
Demonstration 2
The following code
  clf
  colormap jet
  z = 1 : 8;
  x = y = infsup ("[-1, 1]") ./ z;
  plot3 (x, y, z);
  grid on
Produces the following figure
| Figure 1 |
|---|
 |
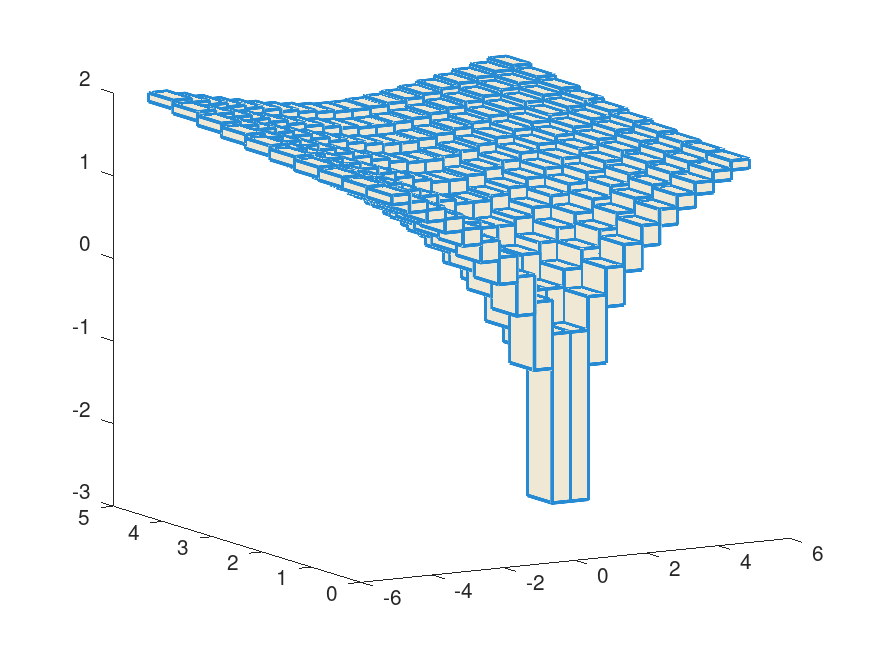
Demonstration 3
The following code
  clf
  [x, y] = meshgrid (mince (infsup ("[-5, 5]"), 20), ...
                     mince (infsup ("[0.1, 5]"), 10));
  z = log (hypot (x, y));
  blue = [38 139 210]/255; base2 = [238 232 213]/255;
  plot3 (x, y, z, base2, blue);
  view (330, 12)
Produces the following figure
| Figure 1 |
|---|
 |
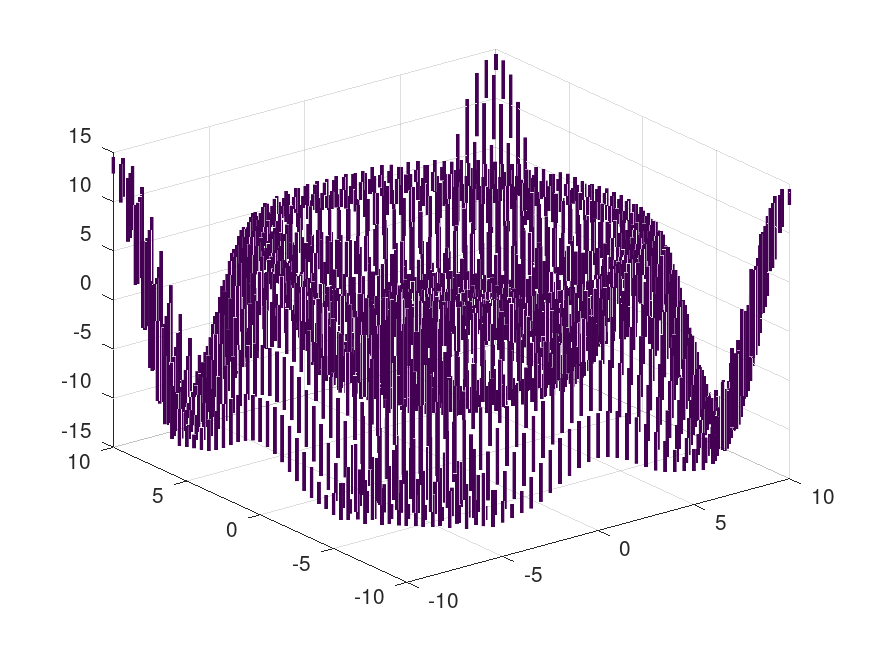
Demonstration 4
The following code
  clf
  [x, y] = meshgrid (midrad (-10 : 0.5 : 10, .25));
  z = sin (hypot (x, y)) .* hypot (x, y);
  plot3 (mid (x), mid (y), z);
  grid on
Produces the following figure
| Figure 1 |
|---|
 |
Package: interval