
|
Octave-Forge - Extra packages for GNU Octave |
| Home · Packages · Developers · Documentation · FAQ · Bugs · Mailing Lists · Links · Code |
|
|
Octave-Forge - Extra packages for GNU Octave |
| Home · Packages · Developers · Documentation · FAQ · Bugs · Mailing Lists · Links · Code |
mdxp = irsa_mdsp (md, rd, N, [rfunc])
Generate N sampling points with a minimum distance md and an additional random distance rd with random distribution rfunc
Input:
md : Scalar – minimum distance
rd : Scalar – mean of the random distance
N : Scalar – number of sampling points to generate
rfunc: String – random distribution function for the random part. Has to take the number of rows as the first and the number of columns as the second argument. Default is 'rand'.
Output:
mdxp : Columnvector – sampling points with a minimum distance
Note:
The first sampling point is 0 and the last
(N-1)*(md + rd).
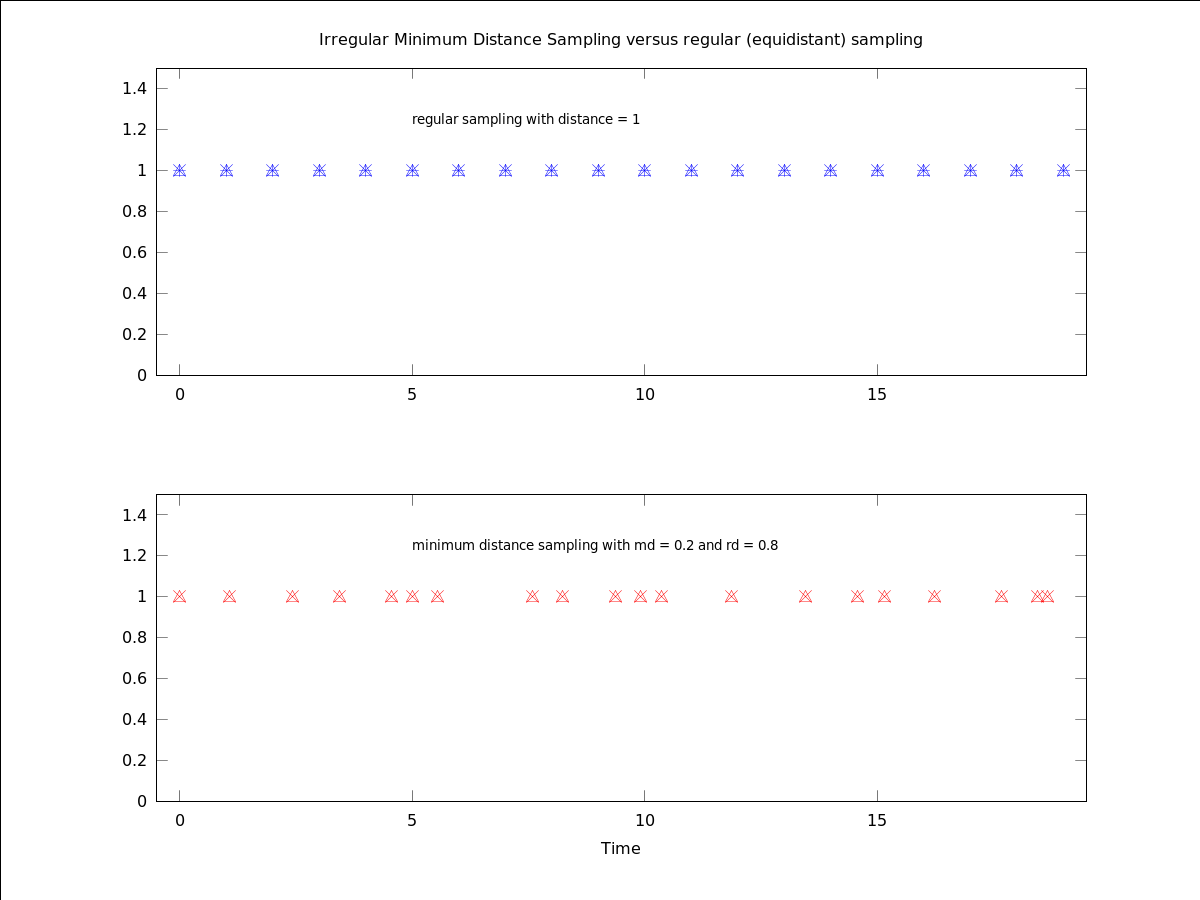
The following code
 N = 25;
 eqxp = irsa_mdsp( 1  , 0 , N ); # Should be the same as [0:1:N-1].'
 mdxp = irsa_mdsp( .2 , .8, N, "randn" );
 o = ones(N,1);
 ## Plot
 figure();
 subplot( 211 );
 plot( eqxp, o, '^b', eqxp, o, '*b' ); text(); title("");
 title( "Irregular Minimum Distance Sampling versus regular (equidistant) sampling" );
 legend('off');
 axis ([-0.5,19.5,0,1.5]);
 text( 5,1.25, 'regular sampling with distance = 1' );
 subplot( 212 );
 plot( mdxp, o, '^r', mdxp, o, 'xr' ); text;
 xlabel( "Time" );
 text( 5,1.25, 'minimum distance sampling with md = 0.2 and rd = 0.8' );
 legend('off');
 axis ([-0.5,19.5,0,1.5]);
Produces the following figure
| Figure 1 |
|---|
 |