
|
Octave-Forge - Extra packages for GNU Octave |
| Home · Packages · Developers · Documentation · FAQ · Bugs · Mailing Lists · Links · Code |
|
|
Octave-Forge - Extra packages for GNU Octave |
| Home · Packages · Developers · Documentation · FAQ · Bugs · Mailing Lists · Links · Code |
Function File: irsa_rgenreal.m
[yp,fxp,fyp] = irsa_rgenreal (xp, fmax, arfunc, prfunc)
Generate a real-valued band-limited timeseries with sampling points xp and maximum frequency fmax.
Input:
xp : Vector – sampling points
fmax : Scalar – maximum (band-limiting) frequency
arfunc: String – name of random number generator with desired distribution for the generated frequency amplitudes. Default is
randn.prfunc: String – name of random number generator with desired distribution for the generated frequency phases taken times
2*pi. Default isrand.The random number generators have to take the number of rows as the first and the number of columns as the second argument.
Output:
yp : Columnvector – sampling values
fxp : Columnvector – frequency points
fyp : Columnvector – frequency values
The following code
N = 32; xp1 = 1.5; ofac = 16;
xp = irsa_mdsp( 0.01, 0.99, N, "rand" ) + xp1;
longxp = linspace( 0, N-(1/ofac), N*ofac ) + xp1;
[yp, fxp, fyp] = irsa_rgenreal( xp, 1/8 );
longyp = irsa_idft( fxp, fyp, longxp, true )*16;
figure();
plot( longxp, longyp, '-r', xp, yp, '*b' );
title( "Irregular timeseries with mean spacing 1 and fmax = 1/8" );
xlabel( "Sampling points" );
ylabel( "Sampling values" );
legend('off');
hold on;
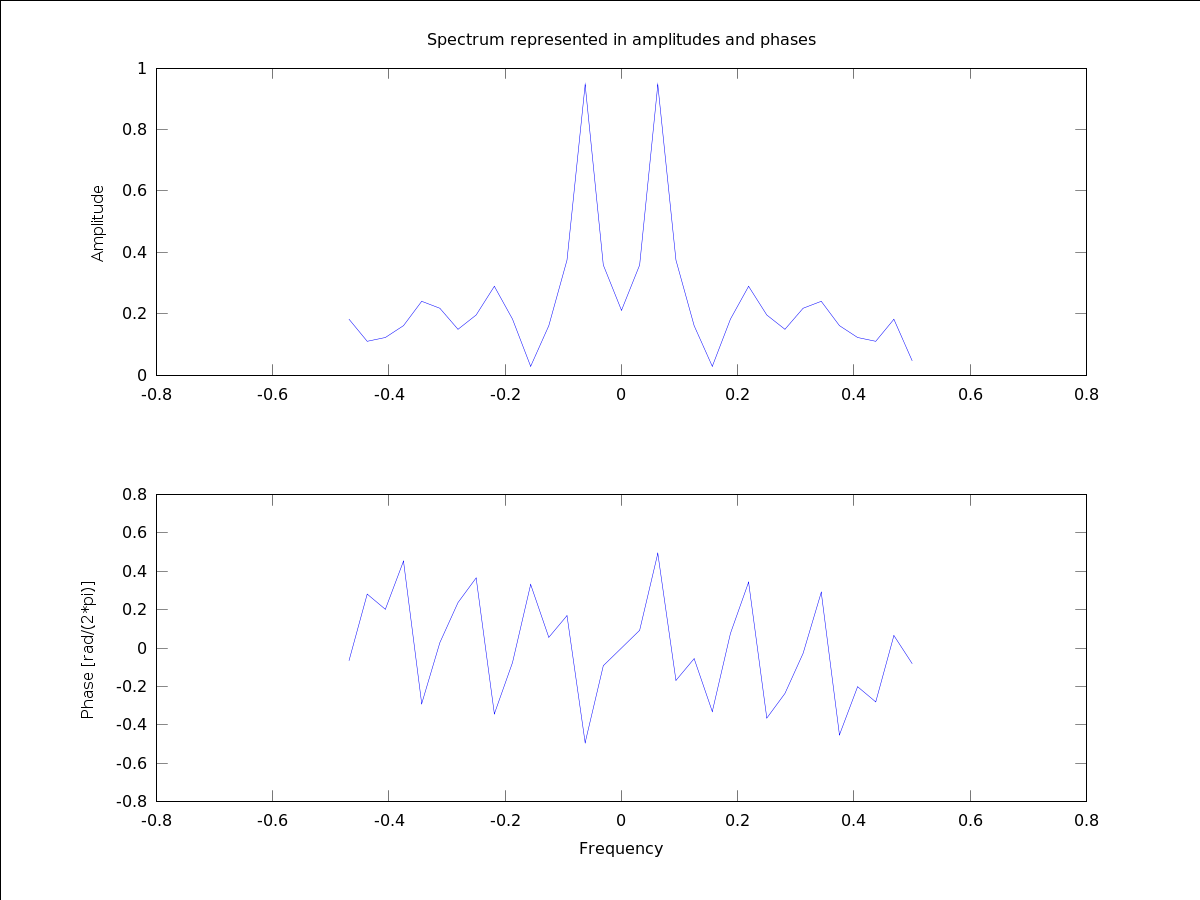
input("Press Enter to see the spectrum up to the band-limit");
irsa_plotdft( fxp, fyp );
input("Press Enter to see the spectrum via DFT");
fxp = irsa_dftfp( xp );
fyp = irsa_dft( xp, yp, fxp );
irsa_plotdft( fxp, fyp );
Produces the following output
Press Enter to see the spectrum up to the band-limit
Press Enter to see the spectrum via DFT
and the following figure
| Figure 1 |
|---|
 |