- Function file:
x, yz_curve(n)¶ Creates an iteration of the Z-order space-filling curve with n points. The argument n must be of the form
2^M, where m is an integer greater than 0.n = 8 [x ,y] = z_curve (n); line (x, y, "linewidth", 4, "color", "blue");
Demonstration 1
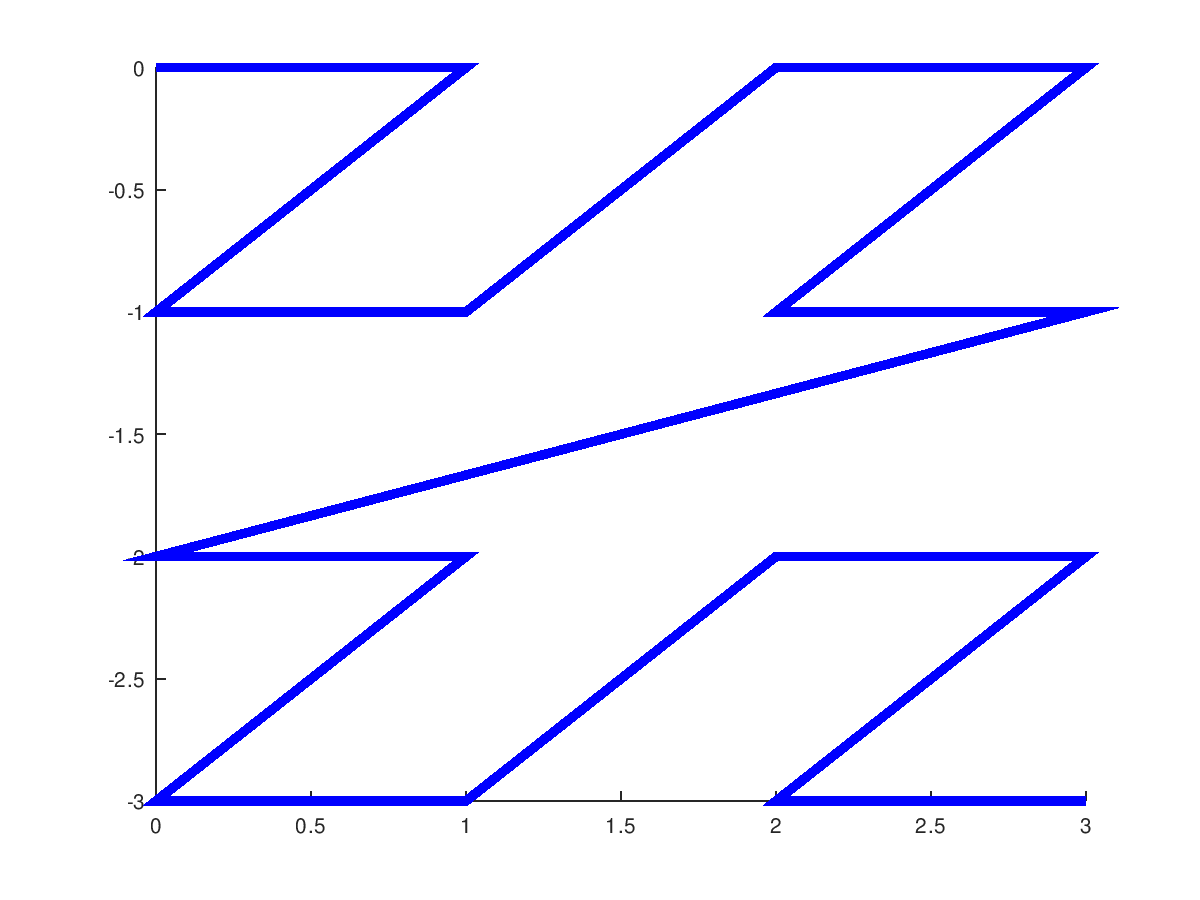
The following code
 clf
 n = 4;
 [x, y] = z_curve (n);
 line (x, y, "linewidth", 4, "color", "blue");
 % -----------------------------------------------------------------------
 % the figure window shows an iteration of the Z-order space-fillig curve
 % with 4 points on each axis.
Produces the following figure
| Figure 1 |
|---|
 |
Demonstration 2
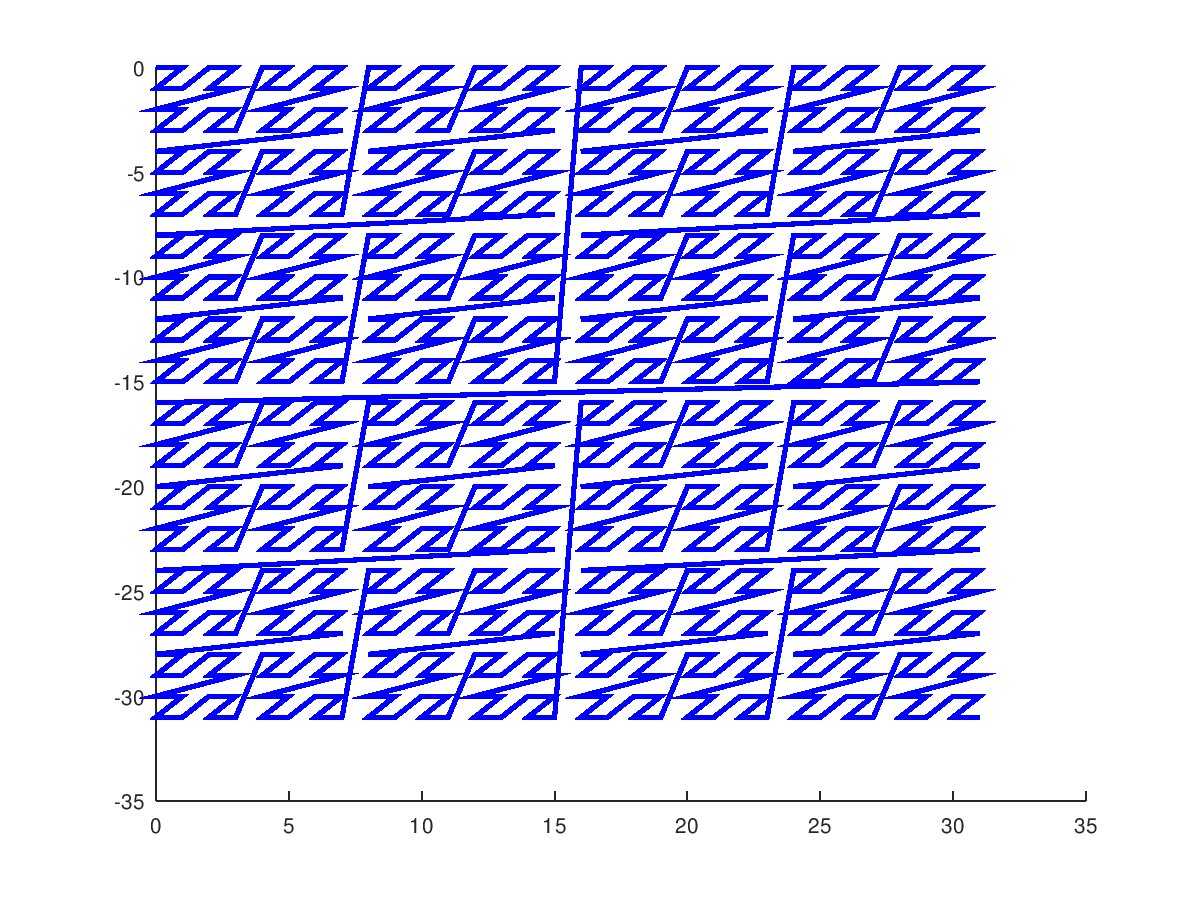
The following code
 clf
 n = 32;
 [x, y] = z_curve (n);
 line (x, y, "linewidth", 2, "color", "blue");
 % ----------------------------------------------------------------------
 % the figure window shows an iteration of the Z-order space-fillig curve
 % with 32 points on each axis.
Produces the following figure
| Figure 1 |
|---|
 |
Package: miscellaneous