 NRBCTRLPLOT: Plot a NURBS entity along with its control points.

 Calling Sequence:

   nrbctrlplot (nurbs)
   nrbkntplot(nurbs, npnts)

 INPUT:

   nurbs: NURBS curve, surface or volume, see nrbmak.
   npnts: Number of evaluation points, for a surface or volume, a row
       vector with the number of points along each direction.

 Example:

   Plot the test curve and test surface with their control polygon and
    control net, respectively

   nrbctrlplot(nrbtestcrv)
   nrbctrlplot(nrbtestsrf)

 See also:

   nrbkntplot

    Copyright (C) 2011, 2012 Rafael Vazquez

    This program is free software: you can redistribute it and/or modify
    it under the terms of the GNU General Public License as published by
    the Free Software Foundation, either version 3 of the License, or
    (at your option) any later version.
Demonstration 1
The following code
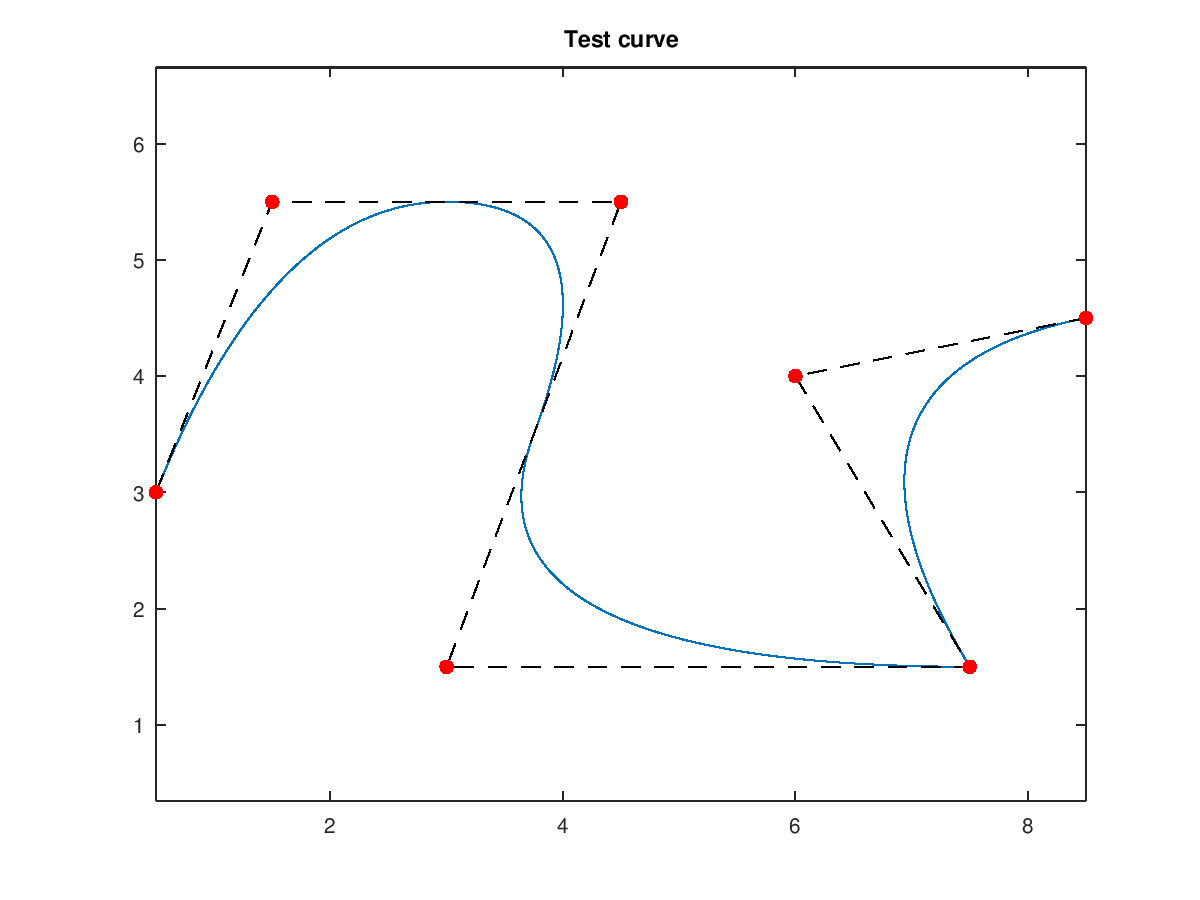
 crv = nrbtestcrv;
 nrbctrlplot(crv)
 title('Test curve')
 hold off
Produces the following figure
| Figure 1 |
|---|
 |
Demonstration 2
The following code
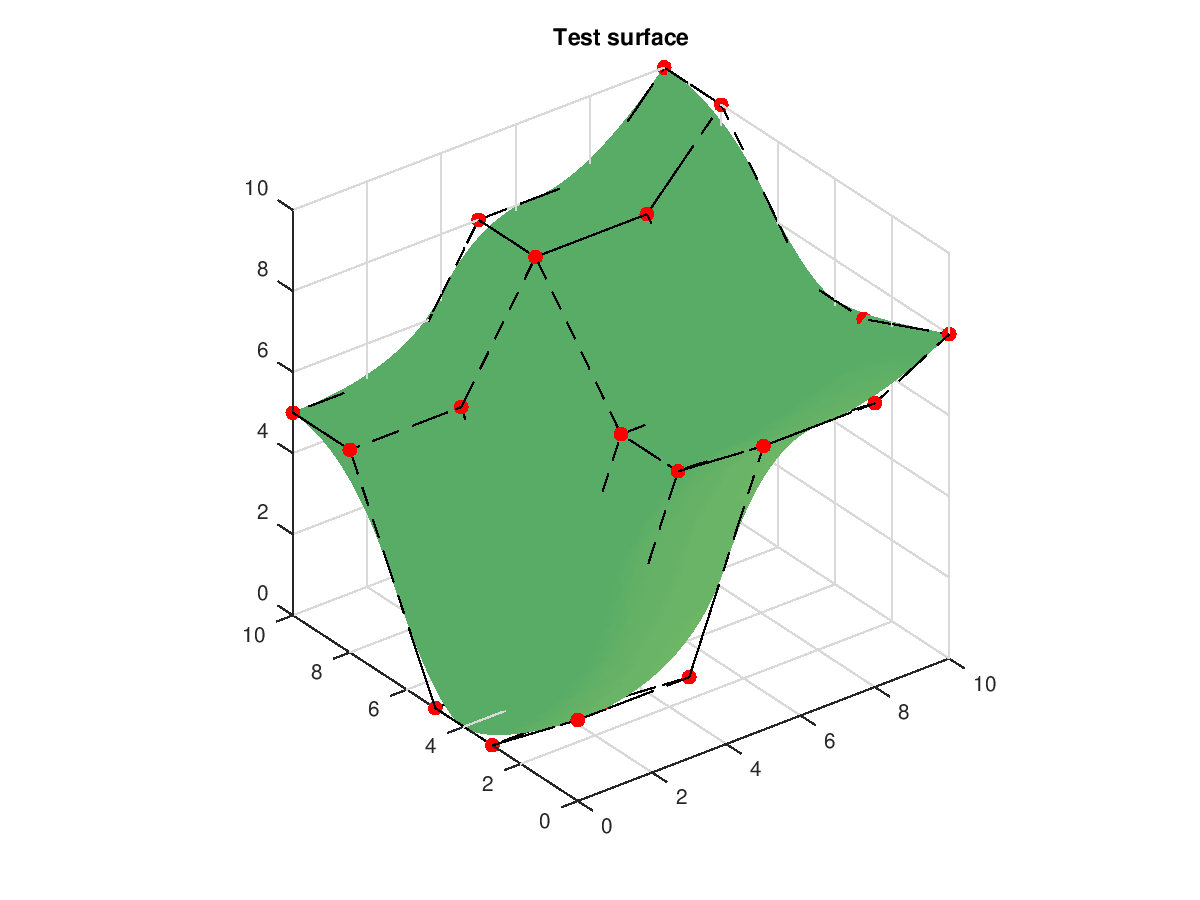
 srf = nrbtestsrf;
 nrbctrlplot(srf)
 title('Test surface')
 hold off
Produces the following figure
| Figure 1 |
|---|
 |
Package: nurbs