 NRBDERIV: Construct up to the fourth derivative representation of a
           NURBS curve, surface or volume.

 Calling Sequence:

   ders = nrbderiv (nrb);
   [ders, ders2] = nrbderiv (nrb);
   [ders, ders2, ders3] = nrbderiv (nrb);
   [ders, ders2, ders, ders4] = nrbderiv (nrb);

 INPUT:

   nrb		: NURBS data structure, see nrbmak.

 OUTPUT:

   ders:  A data structure that represents the first
 		    derivatives of a NURBS curve, surface or volume.
   ders2: A data structure that represents the second
 		    derivatives of a NURBS curve, surface or volume.
   ders3: A data structure that represents the third
 		    derivatives of a NURBS curve, surface or volume. (only surface
 		    for now)
   ders4: A data structure that represents the fourth
 		    derivatives of a NURBS curve, surface or volume. (only surface
 		    for now)


 Description:

   The derivatives of a B-Spline are themselves a B-Spline of lower degree,
   giving an efficient means of evaluating multiple derivatives. However,
   although the same approach can be applied to NURBS, the situation for
   NURBS is more complex. We have followed in this function the same idea
   that was already used for the first derivative in the function nrbderiv.
   The second derivative data structure can be evaluated later with the
   function nrbdeval.

 See also:

       nrbdeval

 Copyright (C) 2000 Mark Spink
 Copyright (C) 2010 Carlo de Falco
 Copyright (C) 2010, 2011 Rafael Vazquez
 Copyright (C) 2018 Luca Coradello

    This program is free software: you can redistribute it and/or modify
    it under the terms of the GNU General Public License as published by
    the Free Software Foundation, either version 3 of the License, or
    (at your option) any later version.
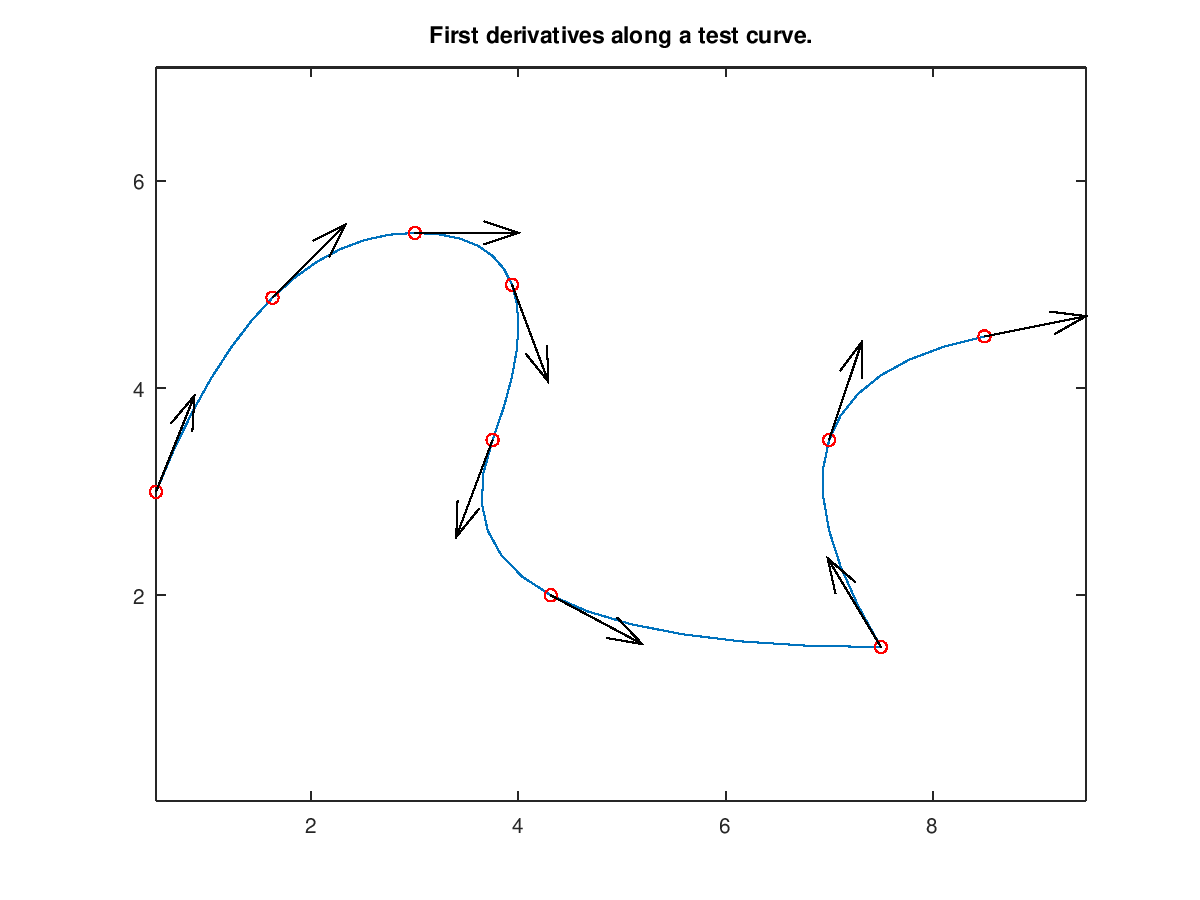
Demonstration 1
The following code
 crv = nrbtestcrv;
 nrbplot(crv,48);
 title('First derivatives along a test curve.');

 tt = linspace(0.0,1.0,9);

 dcrv = nrbderiv(crv);

 [p1, dp] = nrbdeval(crv,dcrv,tt);

 p2 = vecnormalize(dp);

 hold on;
 plot(p1(1,:),p1(2,:),'ro');
 h = quiver(p1(1,:),p1(2,:),p2(1,:),p2(2,:),0);
 set(h,'Color','black');
 hold off;
Produces the following figure
| Figure 1 |
|---|
 |
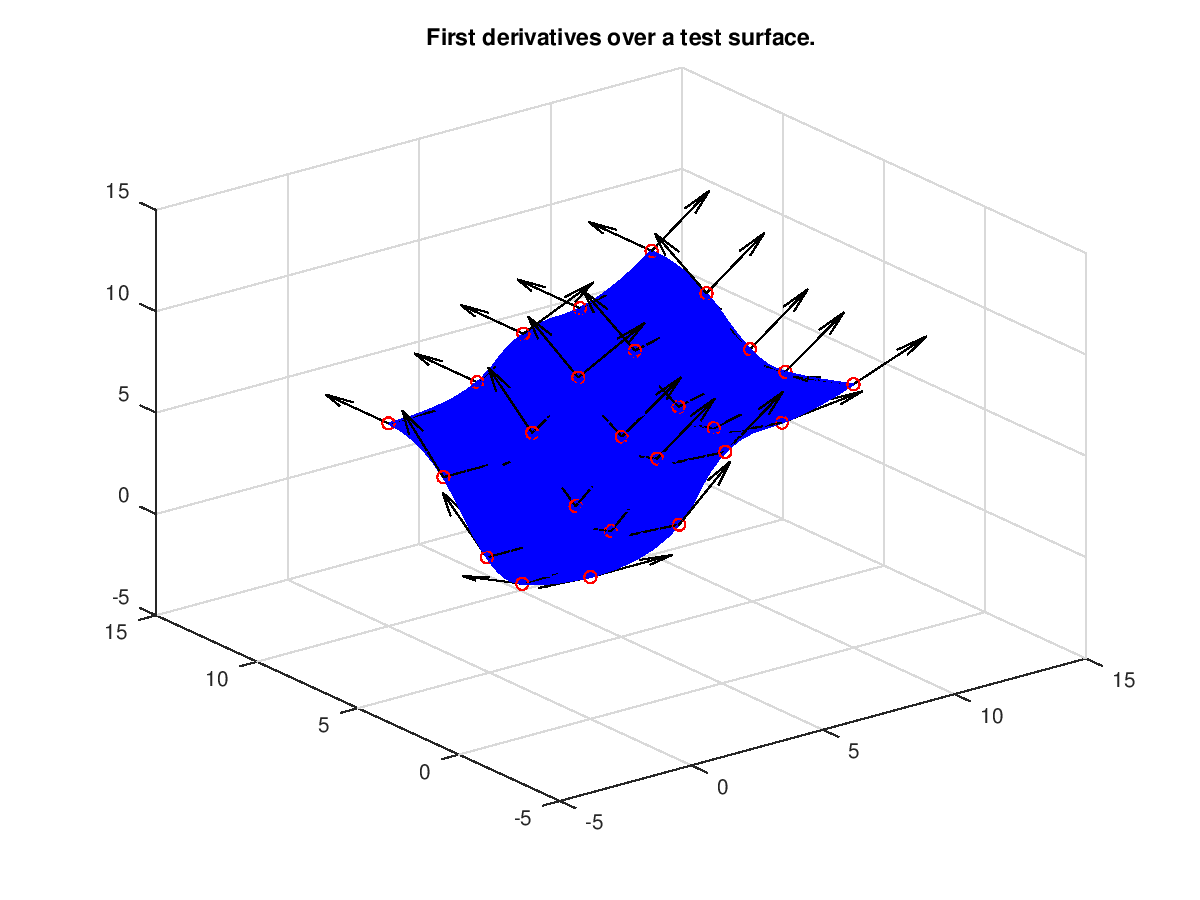
Demonstration 2
The following code
 srf = nrbtestsrf;
 p = nrbeval(srf,{linspace(0.0,1.0,20) linspace(0.0,1.0,20)});
 h = surf(squeeze(p(1,:,:)),squeeze(p(2,:,:)),squeeze(p(3,:,:)));
 set(h,'FaceColor','blue','EdgeColor','blue');
 title('First derivatives over a test surface.');

 npts = 5;
 tt = linspace(0.0,1.0,npts);
 dsrf = nrbderiv(srf);

 [p1, dp] = nrbdeval(srf, dsrf, {tt, tt});

 up2 = vecnormalize(dp{1});
 vp2 = vecnormalize(dp{2});

 hold on;
 plot3(p1(1,:),p1(2,:),p1(3,:),'ro');
 h1 = quiver3(p1(1,:),p1(2,:),p1(3,:),up2(1,:),up2(2,:),up2(3,:));
 h2 = quiver3(p1(1,:),p1(2,:),p1(3,:),vp2(1,:),vp2(2,:),vp2(3,:));
 set(h1,'Color','black');
 set(h2,'Color','black');

 hold off;
Produces the following figure
| Figure 1 |
|---|
 |
Package: nurbs