 NRBKNTINS: Insert a single or multiple knots into a NURBS curve,
            surface or volume.

 Calling Sequence:

   icrv = nrbkntins(crv,iuknots);
   isrf = nrbkntins(srf,{iuknots ivknots});
   ivol = nrbkntins(vol,{iuknots ivknots iwknots});

 INPUT:

   crv		: NURBS curve, see nrbmak.

   srf		: NURBS surface, see nrbmak.

   srf		: NURBS volume, see nrbmak.

   iuknots	: Knots to be inserted along U direction.

   ivknots	: Knots to be inserted along V direction.

   iwknots	: Knots to be inserted along W direction.

 OUTPUT:

   icrv	: new NURBS structure for a curve with knots inserted.

   isrf	: new NURBS structure for a surface with knots inserted.

   ivol	: new NURBS structure for a volume with knots inserted.

 Description:

   Inserts knots into the NURBS data structure, these can be knots at
   new positions or at the location of existing knots to increase the
   multiplicity. The knot multiplicity can be increased up to the order of
   the spline. Any further increase of the multiplicity will generate zero
   basis functions, but not cause any error in the code.
   This function use the B-Spline function bspkntins, which interfaces to
   an internal 'C' routine.

 Examples:

   Insert two knots into a curve, one at 0.3 and another
   twice at 0.4

   icrv = nrbkntins(crv, [0.3 0.4 0.4])

   Insert into a surface two knots as (1) into the U knot
   sequence and one knot into the V knot sequence at 0.5.

   isrf = nrbkntins(srf, {[0.3 0.4 0.4] [0.5]})

 See also:

   bspkntins

 Note:

   The knot multiplicty can be increased beyond the order of the spline
   without causing errors, but the added basis functions will be equal to
   zero.

    Copyright (C) 2000 Mark Spink, 2010 Rafael Vazquez

    This program is free software: you can redistribute it and/or modify
    it under the terms of the GNU General Public License as published by
    the Free Software Foundation, either version 3 of the License, or
    (at your option) any later version.
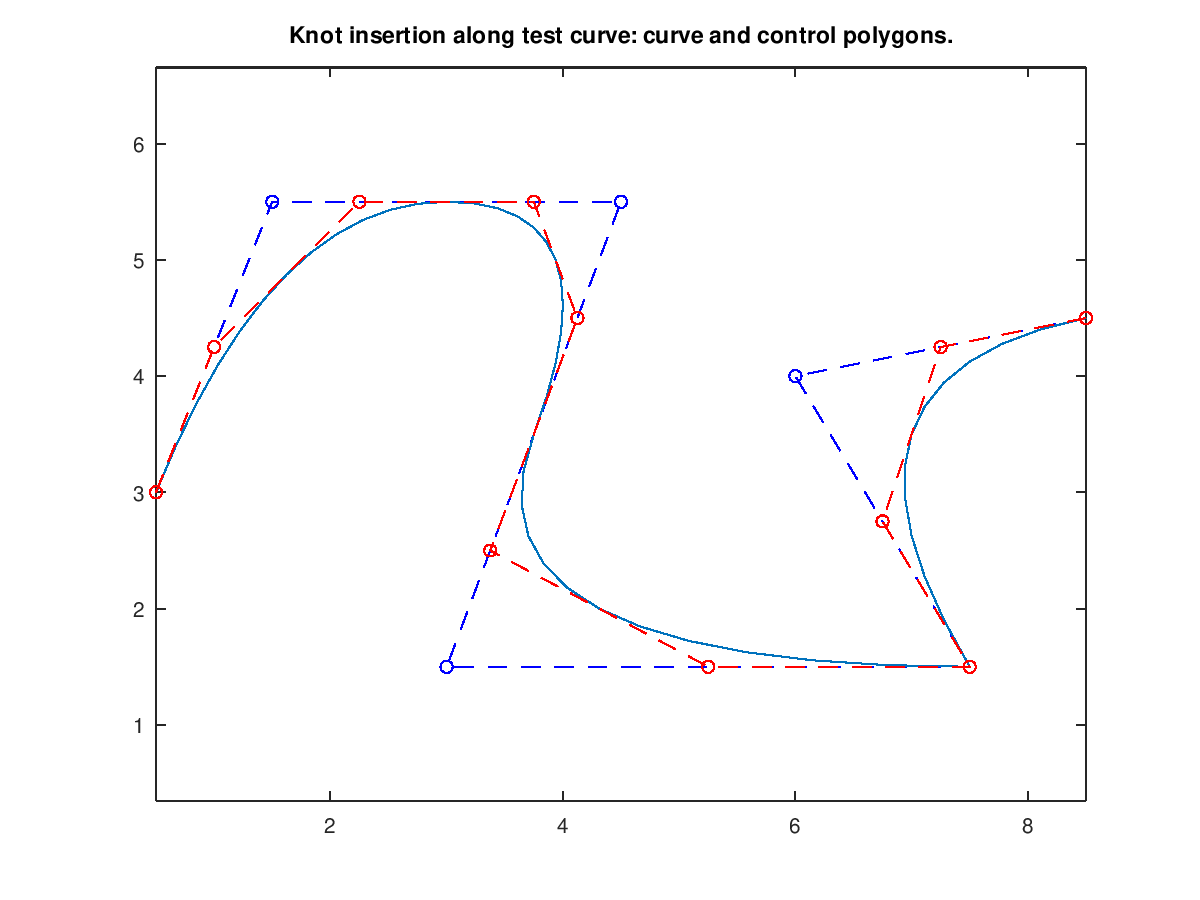
Demonstration 1
The following code
 crv = nrbtestcrv;
 plot(crv.coefs(1,:),crv.coefs(2,:),'bo')
 title('Knot insertion along test curve: curve and control polygons.');
 hold on;
 plot(crv.coefs(1,:),crv.coefs(2,:),'b--');

 nrbplot(crv,48);

 icrv = nrbkntins(crv,[0.125 0.375 0.625 0.875] );
 plot(icrv.coefs(1,:),icrv.coefs(2,:),'ro')
 plot(icrv.coefs(1,:),icrv.coefs(2,:),'r--');
 hold off
Produces the following figure
| Figure 1 |
|---|
 |
Package: nurbs