
|
Octave-Forge - Extra packages for GNU Octave |
| Home · Packages · Developers · Documentation · FAQ · Bugs · Mailing Lists · Links · Code |
|
|
Octave-Forge - Extra packages for GNU Octave |
| Home · Packages · Developers · Documentation · FAQ · Bugs · Mailing Lists · Links · Code |
Add date formatted tick labels to an axis.
The axis to apply the ticks to is determined by axis_str which can
take the values "x", "y", or "z". The default
value is "x".
The formatting of the labels is determined by the variable
date_format, which can either be a string or positive integer that
datestr accepts.
See also: datenum, datestr.
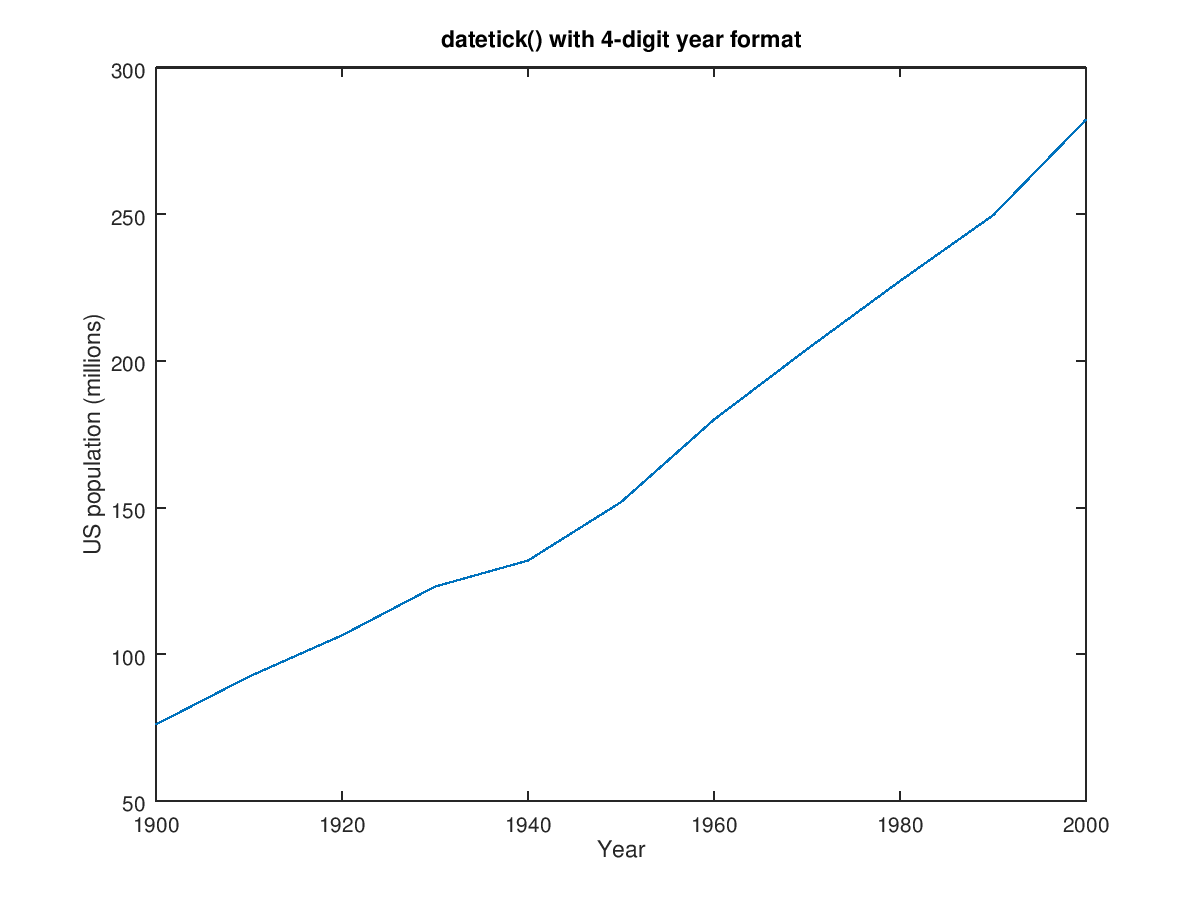
The following code
 clf;
 yr = 1900:10:2000;
 pop = [76.094, 92.407, 106.461, 123.077 131.954, 151.868, 179.979, ...
        203.984, 227.225, 249.623, 282.224];
 plot (datenum (yr, 1, 1), pop);
 xlabel ("Year");
 ylabel ("US population (millions)");
 title ("datetick() with 4-digit year format");
 datetick ("x", "YYYY");
Produces the following figure
| Figure 1 |
|---|
 |
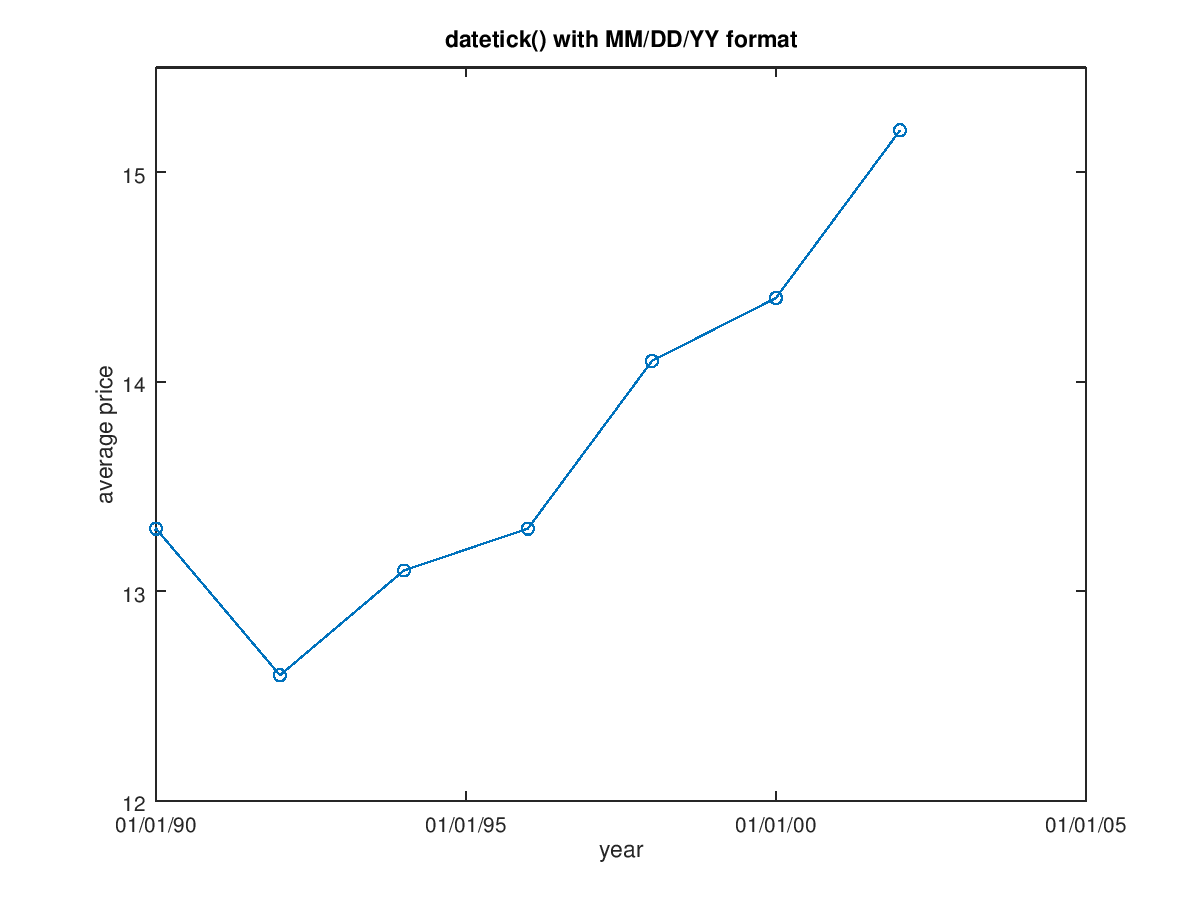
The following code
 clf;
 yr = 1988:2:2002;
 yr = datenum (yr,1,1);
 pr = [12.1 13.3 12.6 13.1 13.3 14.1 14.4 15.2];
 plot (yr, pr, "-o");
 xlabel ("year");
 ylabel ("average price");
 title ("datetick() with MM/DD/YY format");
 ax = gca;
 set (ax, "xtick", datenum (1990:5:2005,1,1));
 datetick ("x", 2, "keepticks");
 set (ax, "ytick", 12:16);
Produces the following figure
| Figure 1 |
|---|
 |
Package: octave