
|
Octave-Forge - Extra packages for GNU Octave |
| Home · Packages · Developers · Documentation · FAQ · Bugs · Mailing Lists · Links · Code |
|
|
Octave-Forge - Extra packages for GNU Octave |
| Home · Packages · Developers · Documentation · FAQ · Bugs · Mailing Lists · Links · Code |
Plot a parametrically defined curve in three dimensions.
fx, fy, and fz are strings, inline functions,
or function handles with one argument defining the function. By
default the plot is over the domain 0 <= t <= 2*pi
with 500 points.
If dom is a two element vector, it represents the minimum and maximum values of t.
n is a scalar defining the number of points to use in plotting the function.
If the "animate" option is given then the plotting is animated
in the style of comet3.
If the first argument hax is an axes handle, then plot into this axis,
rather than the current axes returned by gca.
The optional return value h is a graphics handle to the created plot.
fx = @(t) cos (t);
fy = @(t) sin (t);
fz = @(t) t;
ezplot3 (fx, fy, fz, [0, 10*pi], 100);
See also: plot3, comet3, ezplot, ezmesh, ezsurf.
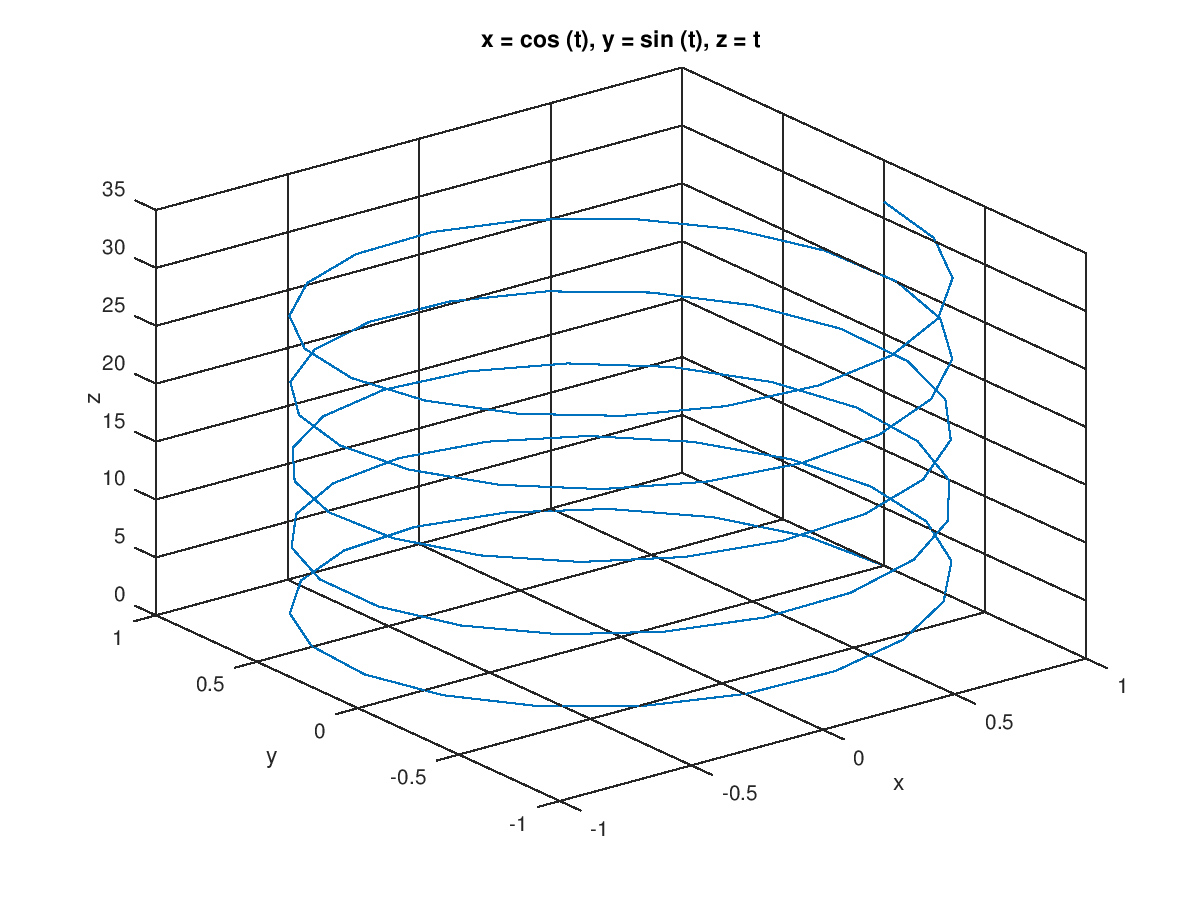
The following code
 clf;
 fx = @(t) cos (t);
 fy = @(t) sin (t);
 fz = @(t) t;
 ezplot3 (fx, fy, fz, [0, 10*pi], 100);
Produces the following figure
| Figure 1 |
|---|
 |
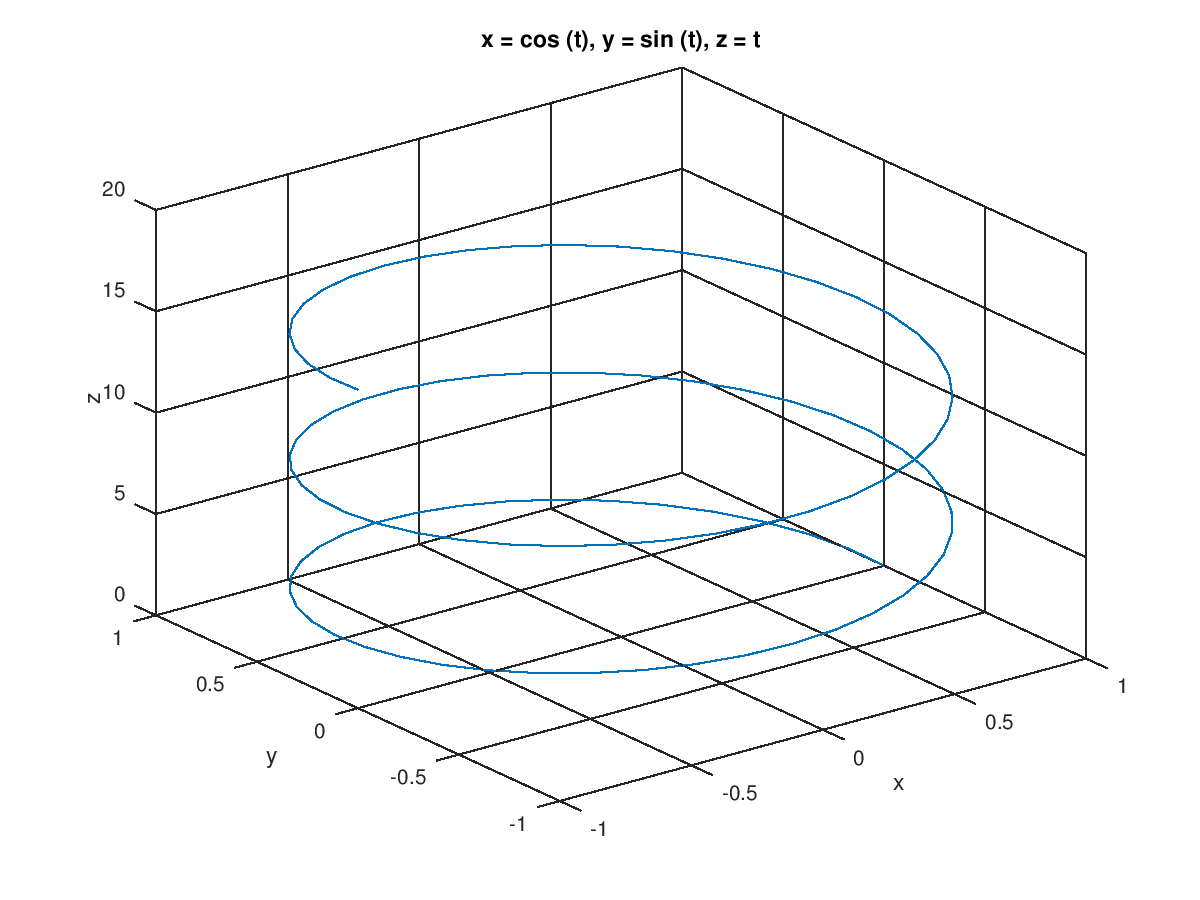
The following code
 clf;
 fx = @(t) cos (t);
 fy = @(t) sin (t);
 fz = @(t) t;
 ezplot3 (fx, fy, fz, [0, 5*pi], 100, "animate");
Produces the following figure
| Figure 1 |
|---|
 |
Package: octave