
|
Octave-Forge - Extra packages for GNU Octave |
| Home · Packages · Developers · Documentation · FAQ · Bugs · Mailing Lists · Links · Code |
|
|
Octave-Forge - Extra packages for GNU Octave |
| Home · Packages · Developers · Documentation · FAQ · Bugs · Mailing Lists · Links · Code |
Plot the surface defined by a function.
f is a string, inline function, or function handle with two arguments
defining the function. By default the plot is over the meshed domain
-2*pi <= x |y <= 2*pi with 60 points in each dimension.
If three functions are passed, then plot the parametrically defined
function [fx (s, t), fy (s, t),
fz (s, t)].
If dom is a two element vector, it represents the minimum and maximum
values of both x and y. If dom is a four element vector,
then the minimum and maximum values are [xmin xmax ymin ymax].
n is a scalar defining the number of points to use in each dimension.
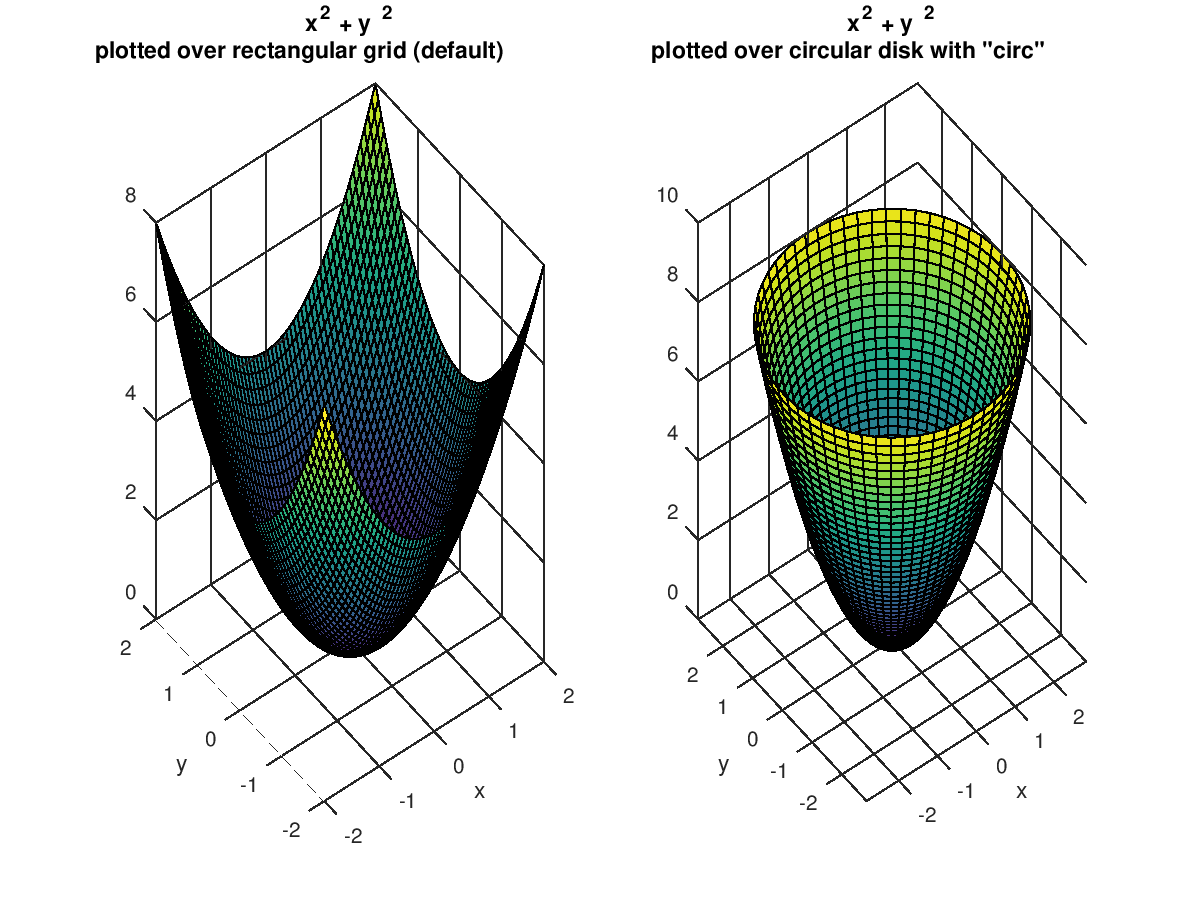
If the argument "circ" is given, then the function is plotted over
a disk centered on the middle of the domain dom.
If the first argument hax is an axes handle, then plot into this axis,
rather than the current axes returned by gca.
The optional return value h is a graphics handle to the created surface object.
Example 1: 2-argument function
f = @(x,y) sqrt (abs (x .* y)) ./ (1 + x.^2 + y.^2);
ezsurf (f, [-3, 3]);
Example 2: parametrically defined function
fx = @(s,t) cos (s) .* cos (t);
fy = @(s,t) sin (s) .* cos (t);
fz = @(s,t) sin (t);
ezsurf (fx, fy, fz, [-pi, pi, -pi/2, pi/2], 20);
See also: surf, ezsurfc, ezplot, ezmesh, ezmeshc, shading.
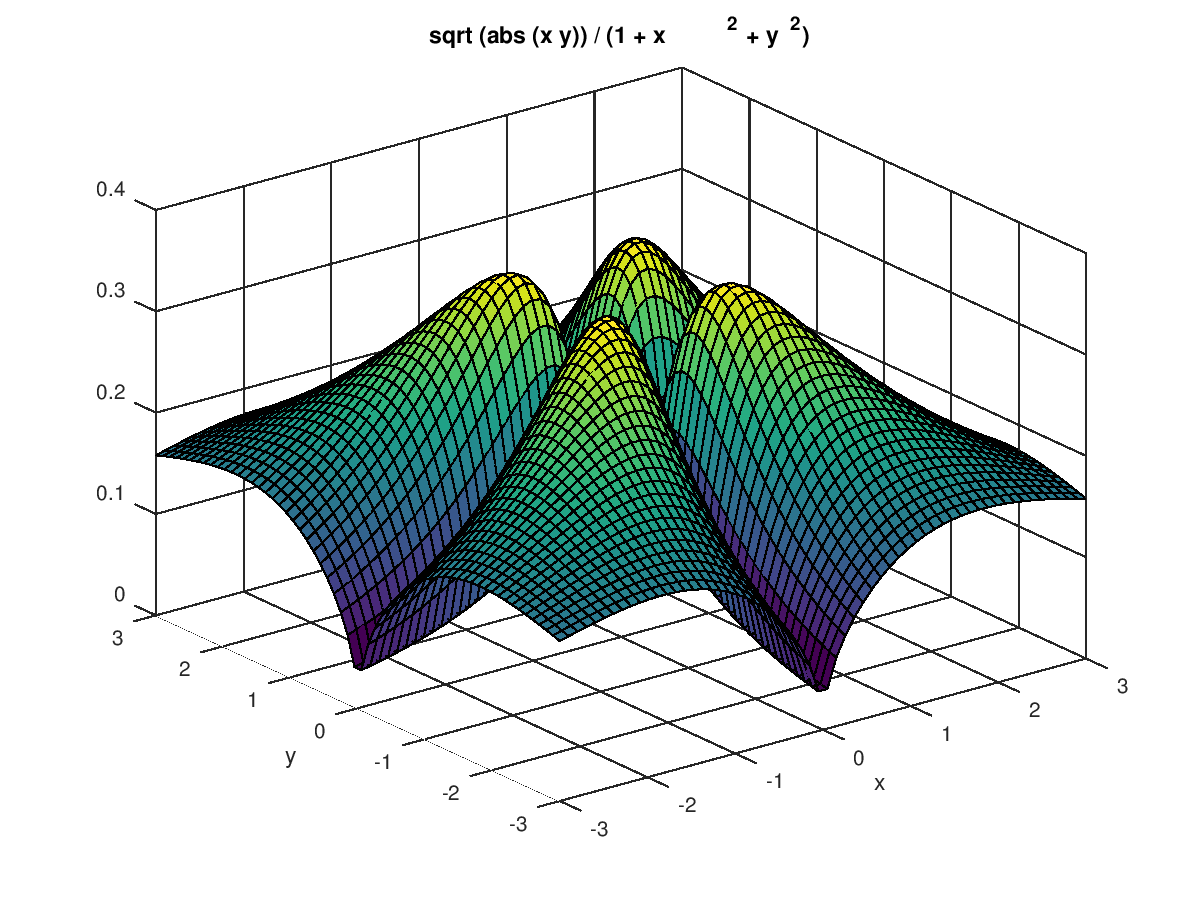
The following code
 clf;
 colormap ("default");
 f = @(x,y) sqrt (abs (x .* y)) ./ (1 + x.^2 + y.^2);
 ezsurf (f, [-3, 3]);
Produces the following figure
| Figure 1 |
|---|
 |
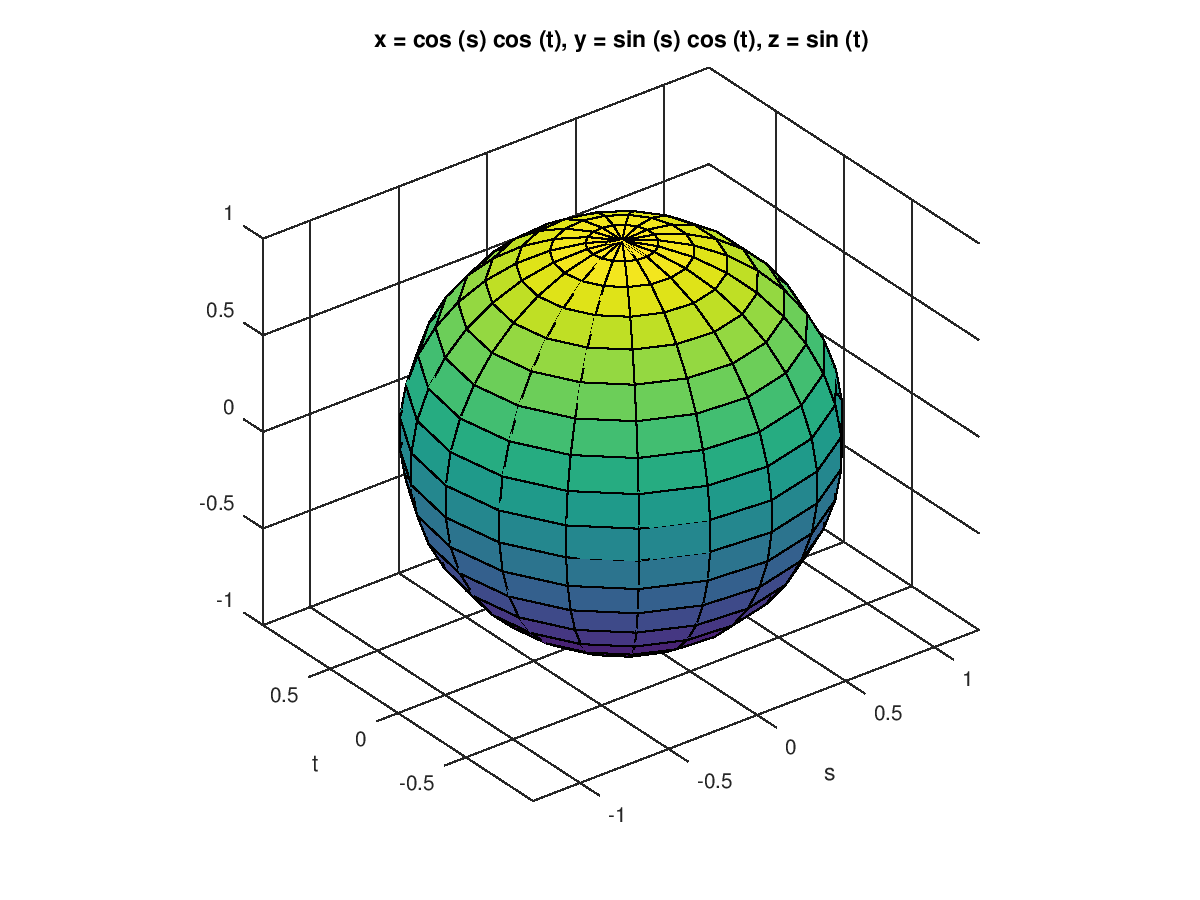
The following code
 clf;
 colormap ("default");
 fx = @(s,t) cos (s) .* cos (t);
 fy = @(s,t) sin (s) .* cos (t);
 fz = @(s,t) sin (t);
 ezsurf (fx, fy, fz, [-pi,pi,-pi/2,pi/2], 20);
 axis equal;
Produces the following figure
| Figure 1 |
|---|
 |
The following code
 clf;
 colormap ("default");
 f = @(x,y) x.^2 + y.^2;
 subplot (1,2,1);
  ezsurf (f, [-2,2]);
  title ({"x^2 + y^2"; "plotted over rectangular grid (default)"});
 subplot (1,2,2);
  ezsurf (f, [-2,2], "circ");
  title ({"x^2 + y^2"; 'plotted over circular disk with "circ"'});
Produces the following figure
| Figure 1 |
|---|
 |
Package: octave