
|
Octave-Forge - Extra packages for GNU Octave |
| Home · Packages · Developers · Documentation · FAQ · Bugs · Mailing Lists · Links · Code |
|
|
Octave-Forge - Extra packages for GNU Octave |
| Home · Packages · Developers · Documentation · FAQ · Bugs · Mailing Lists · Links · Code |
Create one or more filled 2-D polygons.
The inputs x and y are the coordinates of the polygon vertices.
If the inputs are matrices then the rows represent different vertices and
each column produces a different polygon. fill will close any open
polygons before plotting.
The input c determines the color of the polygon. The simplest form
is a single color specification such as a plot format or an
RGB-triple. In this case the polygon(s) will have one unique color. If
c is a vector or matrix then the color data is first scaled using
caxis and then indexed into the current colormap. A row vector will
color each polygon (a column from matrices x and y) with a
single computed color. A matrix c of the same size as x and
y will compute the color of each vertex and then interpolate the face
color between the vertices.
Multiple property/value pairs for the underlying patch object may be specified, but they must appear in pairs.
If the first argument hax is an axes handle, then plot into this axis,
rather than the current axes returned by gca.
The optional return value h is a vector of graphics handles to the created patch objects.
Example: red square
vertices = [0 0
            1 0
            1 1
            0 1];
fill (vertices(:,1), vertices(:,2), "r");
axis ([-0.5 1.5, -0.5 1.5])
axis equal
See also: patch, caxis, colormap.
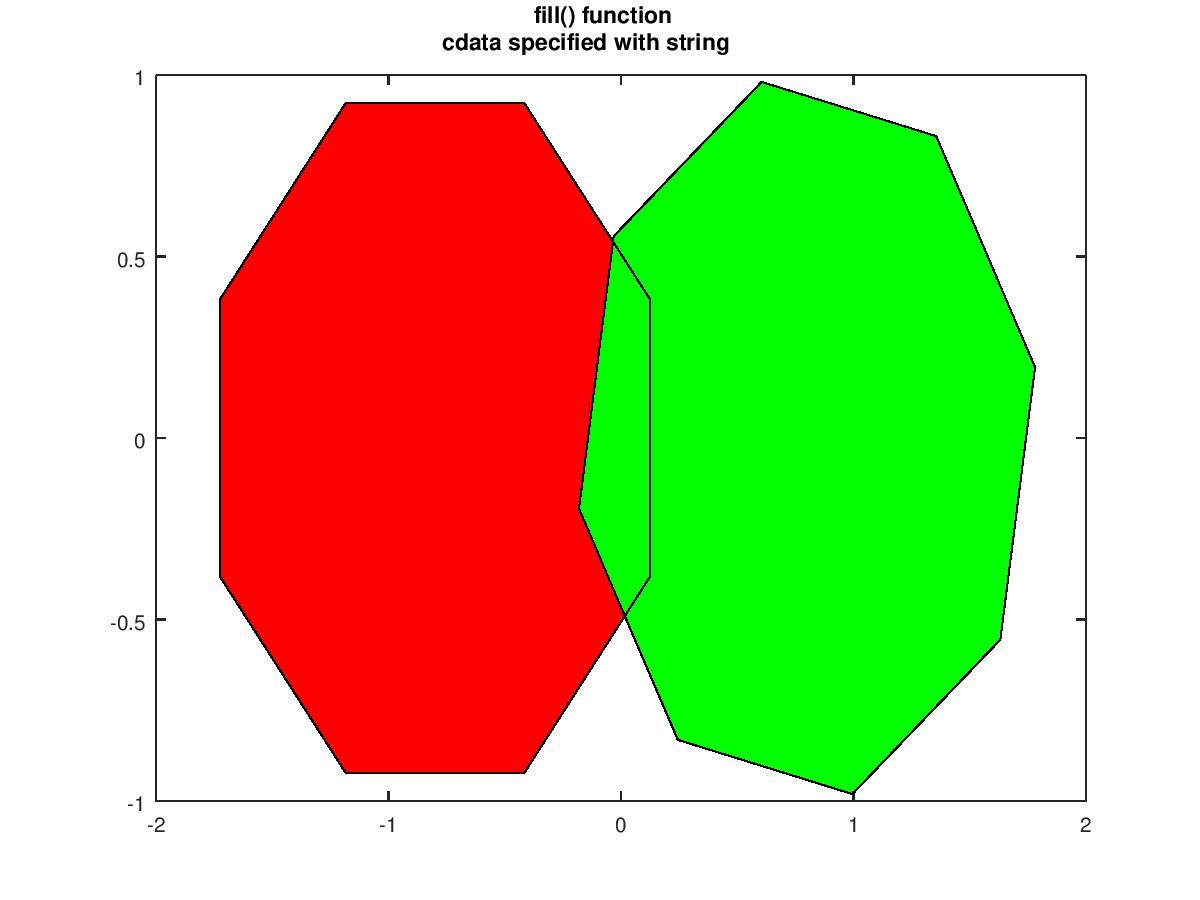
The following code
 clf;
 t1 = (1/16:1/8:1) * 2*pi;
 t2 = ((1/16:1/8:1) + 1/32) * 2*pi;
 x1 = sin (t1) - 0.8;
 y1 = cos (t1);
 x2 = sin (t2) + 0.8;
 y2 = cos (t2);
 h = fill (x1,y1,"r", x2,y2,"g");
 title ({"fill() function"; "cdata specified with string"});
Produces the following figure
| Figure 1 |
|---|
 |
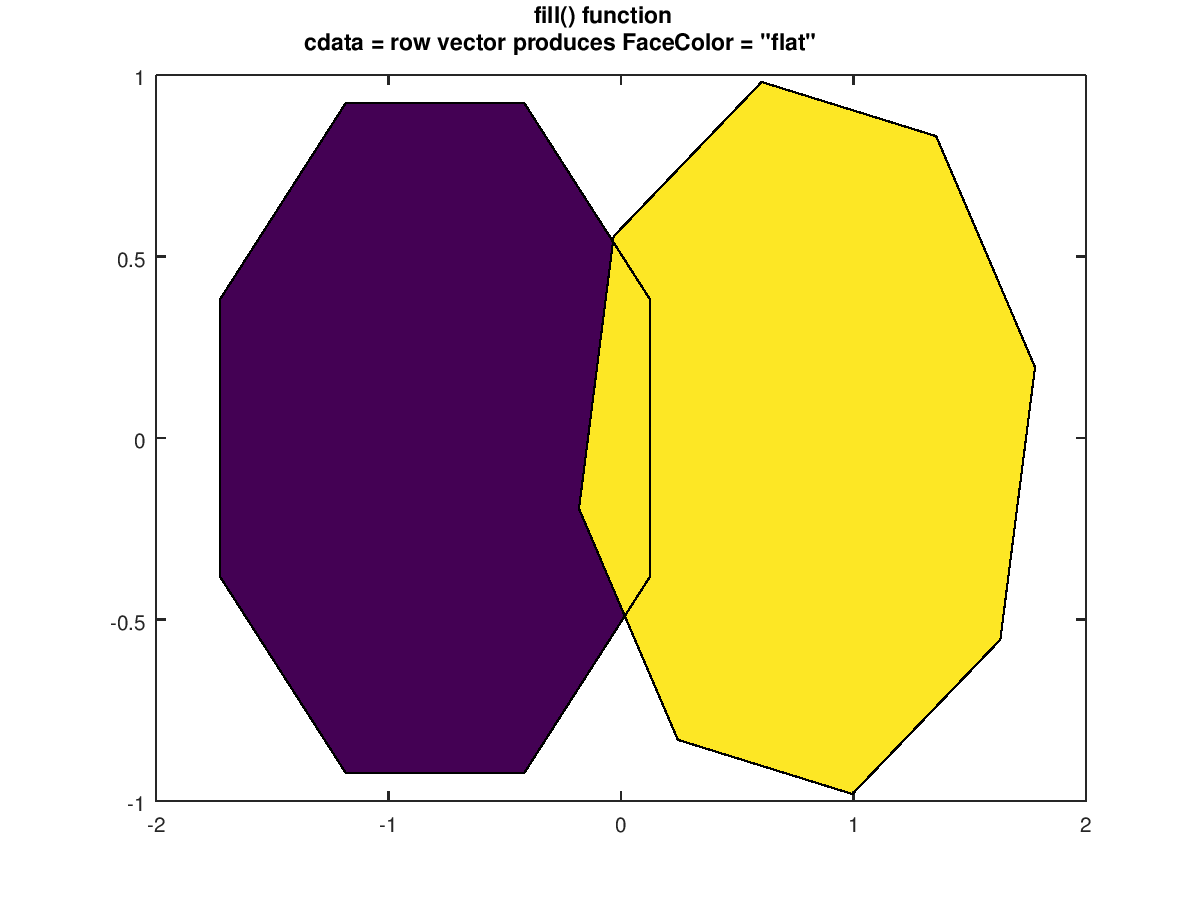
The following code
 clf;
 t1 = (1/16:1/8:1) * 2*pi;
 t2 = ((1/16:1/8:1) + 1/32) * 2*pi;
 x1 = sin (t1) - 0.8;
 y1 = cos (t1);
 x2 = sin (t2) + 0.8;
 y2 = cos (t2);
 h = fill (x1,y1,1, x2,y2,2);
 title ({"fill() function"; 'cdata = row vector produces FaceColor = "flat"'});
Produces the following figure
| Figure 1 |
|---|
 |
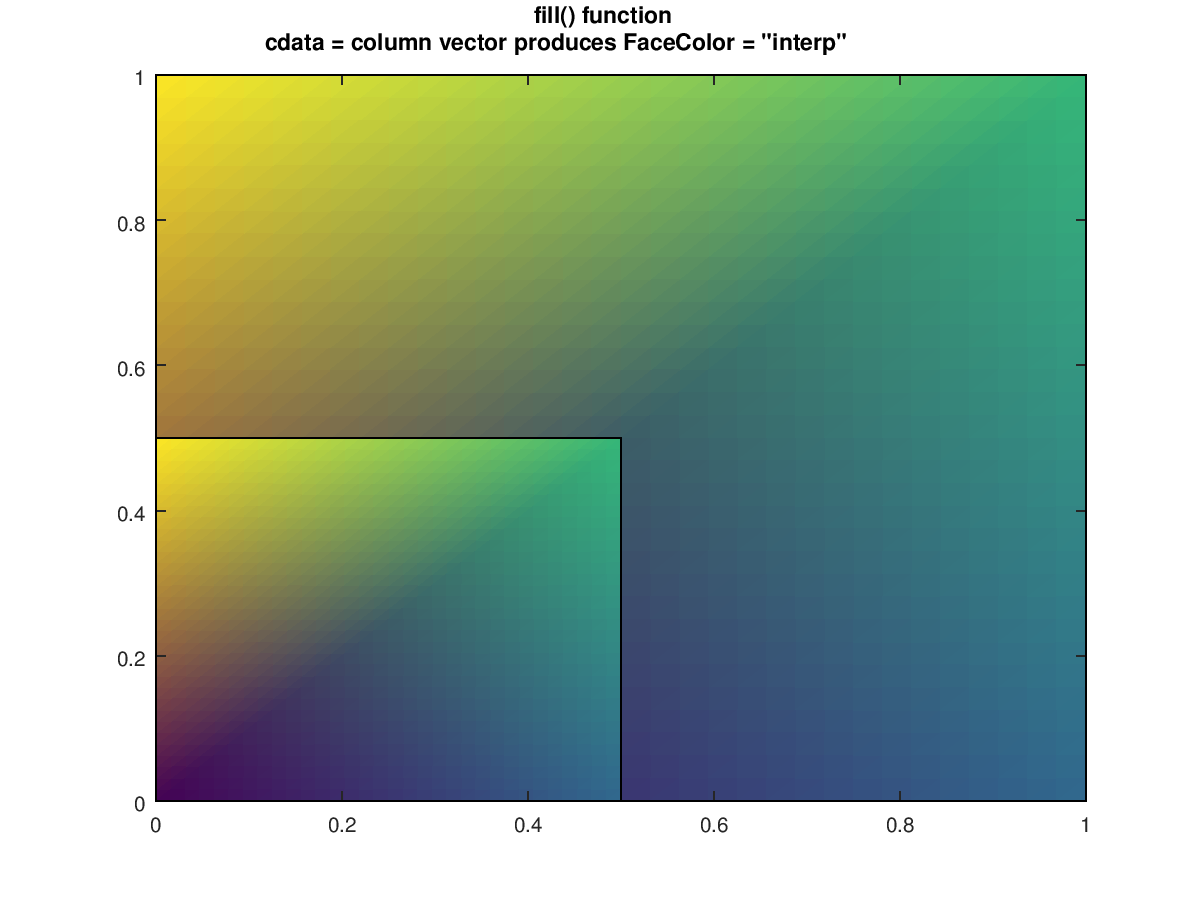
The following code
 clf;
 x = [0 0
      1 0.5
      1 0.5
      0 0];
 y = [0 0
      0 0
      1 0.5
      1 0.5];
 c = [1 2 3 4]';
 fill (x, y, [c c]);
 title ({"fill() function"; 'cdata = column vector produces FaceColor = "interp"'});
Produces the following figure
| Figure 1 |
|---|
 |
Package: octave