
|
Octave-Forge - Extra packages for GNU Octave |
| Home · Packages · Developers · Documentation · FAQ · Bugs · Mailing Lists · Links · Code |
|
|
Octave-Forge - Extra packages for GNU Octave |
| Home · Packages · Developers · Documentation · FAQ · Bugs · Mailing Lists · Links · Code |
Generate a regular mesh from irregular data using interpolation.
The function is defined by z = f (x, y). Inputs
x, y, z are vectors of the same length or
x, y are vectors and z is matrix.
The interpolation points are all (xi, yi). If xi,
yi are vectors then they are made into a 2-D mesh.
The interpolation method can be "nearest", "cubic" or
"linear". If method is omitted it defaults to "linear".
See also: griddata3, griddatan, delaunay.
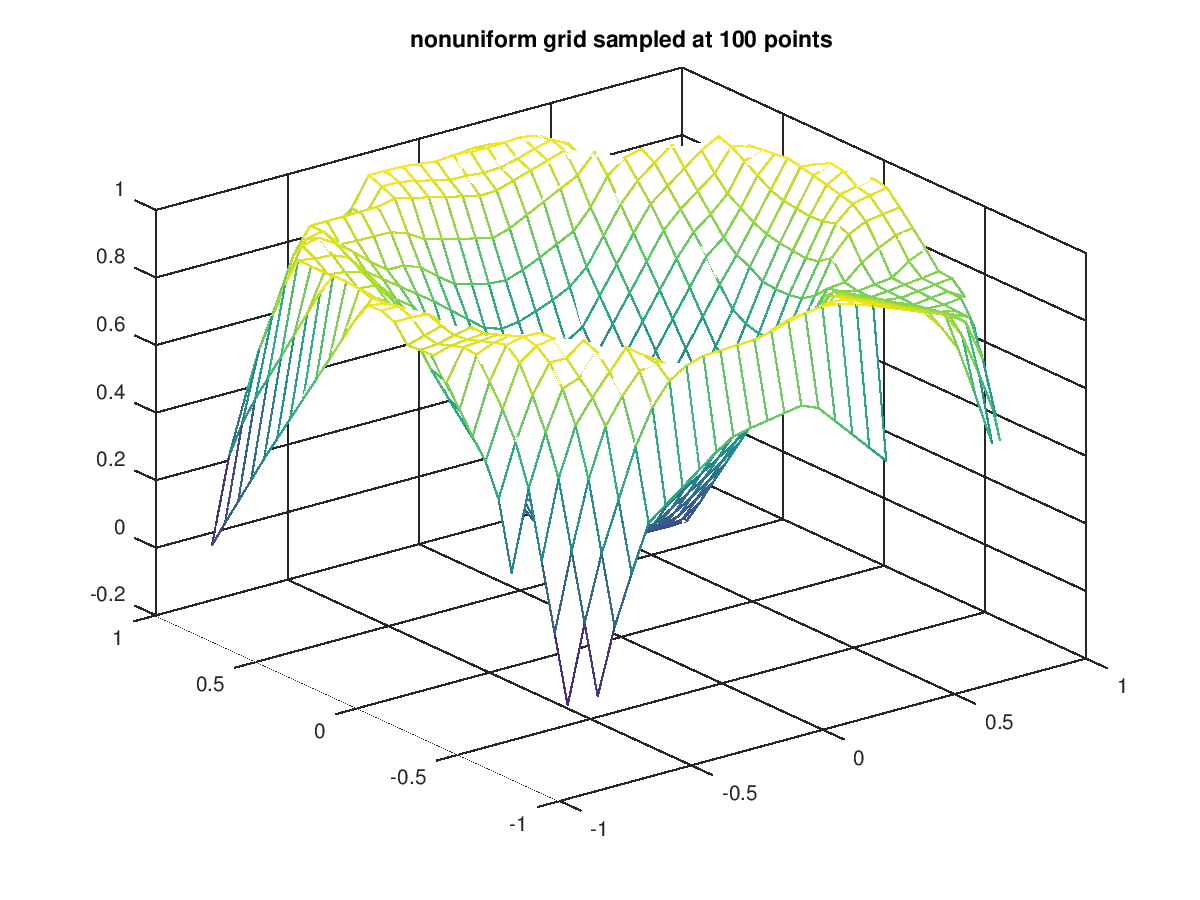
The following code
 clf;
 colormap ("default");
 x = 2*rand (100,1) - 1;
 y = 2*rand (size (x)) - 1;
 z = sin (2*(x.^2 + y.^2));
 [xx,yy] = meshgrid (linspace (-1,1,32));
 zz = griddata (x,y,z,xx,yy);
 mesh (xx, yy, zz);
 title ("nonuniform grid sampled at 100 points");
Produces the following figure
| Figure 1 |
|---|
 |
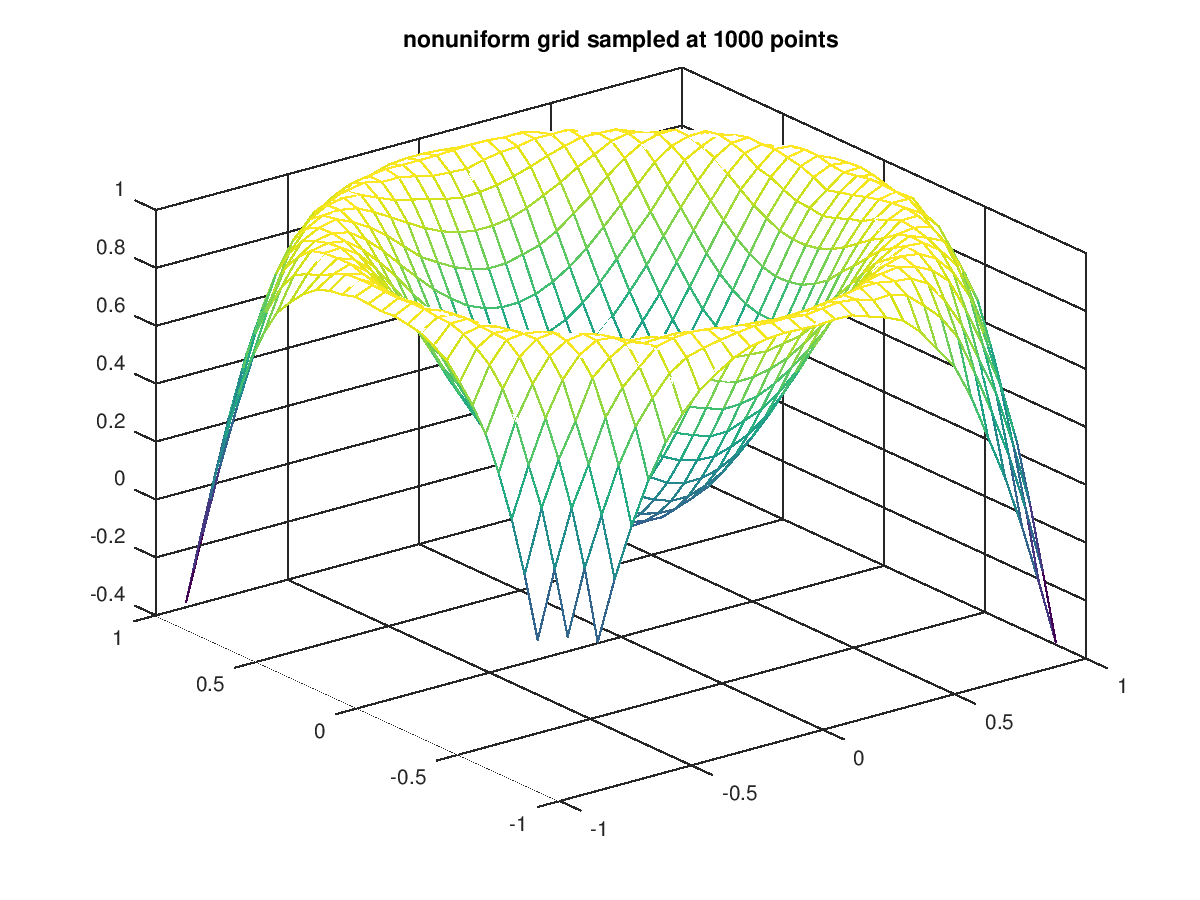
The following code
 clf;
 colormap ("default");
 x = 2*rand (1000,1) - 1;
 y = 2*rand (size (x)) - 1;
 z = sin (2*(x.^2 + y.^2));
 [xx,yy] = meshgrid (linspace (-1,1,32));
 zz = griddata (x,y,z,xx,yy);
 mesh (xx, yy, zz);
 title ("nonuniform grid sampled at 1000 points");
Produces the following figure
| Figure 1 |
|---|
 |
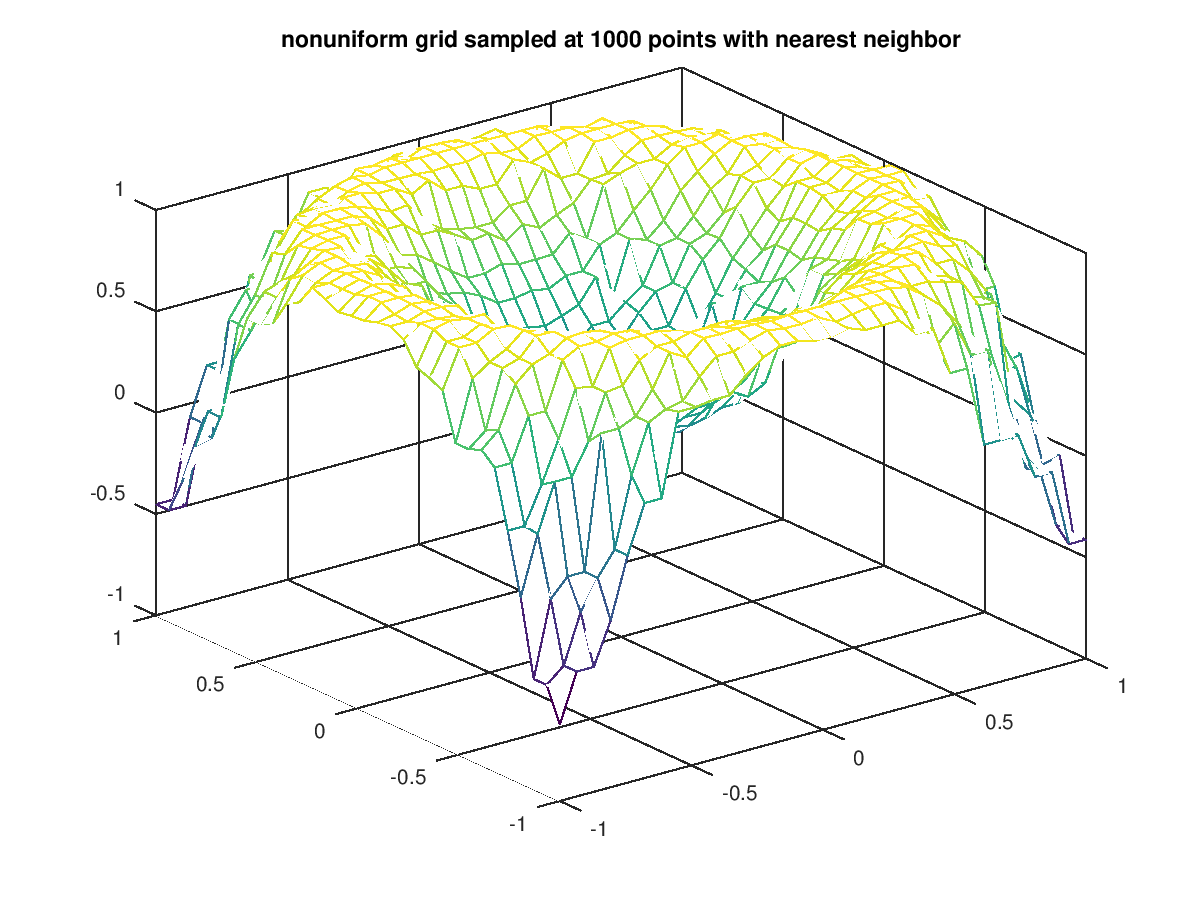
The following code
 clf;
 colormap ("default");
 x = 2*rand (1000,1) - 1;
 y = 2*rand (size (x)) - 1;
 z = sin (2*(x.^2 + y.^2));
 [xx,yy] = meshgrid (linspace (-1,1,32));
 zz = griddata (x,y,z,xx,yy,"nearest");
 mesh (xx, yy, zz);
 title ("nonuniform grid sampled at 1000 points with nearest neighbor");
Produces the following figure
| Figure 1 |
|---|
 |
Package: octave