
|
Octave-Forge - Extra packages for GNU Octave |
| Home · Packages · Developers · Documentation · FAQ · Bugs · Mailing Lists · Links · Code |
|
|
Octave-Forge - Extra packages for GNU Octave |
| Home · Packages · Developers · Documentation · FAQ · Bugs · Mailing Lists · Links · Code |
"verbose")Create end-caps for isosurfaces of 3-D data.
This function places caps at the open ends of isosurfaces.
The input argument v is a three-dimensional array that contains data sampled over a volume.
The input isoval is a scalar that specifies the value for the isosurface. If isoval is omitted or empty, a "good" value for an isosurface is determined from v.
When called with a single output argument, isocaps returns a
structure array fvc with the fields: faces, vertices,
and facevertexcdata. The results are computed at the points
[x, y, z] = meshgrid (1:l, 1:m, 1:n) where
[l, m, n] = size (v). The output fvc can be used
directly as input to the patch function.
If called with additional input arguments x, y, and z
that are three-dimensional arrays with the same size as v or
vectors with lengths corresponding to the dimensions of v, then the
volume data is taken at the specified points. If x, y, or
z are empty, the grid corresponds to the indices (1:n) in
the respective direction (see ‘meshgrid’).
The optional parameter which_caps can have one of the following string values which defines how the data will be enclosed:
"above", "a" (default)for end-caps that enclose the data above isoval.
"below", "b"for end-caps that enclose the data below isoval.
The optional parameter which_plane can have one of the following string values to define which end-cap should be drawn:
"all" (default)for all of the end-caps.
"xmin"for end-caps at the lower x-plane of the data.
"xmax"for end-caps at the upper x-plane of the data.
"ymin"for end-caps at the lower y-plane of the data.
"ymax"for end-caps at the upper y-plane of the data.
"zmin"for end-caps at the lower z-plane of the data.
"zmax"for end-caps at the upper z-plane of the data.
The string input argument "verbose" is supported for MATLAB
compatibility, but has no effect.
If called with two or three output arguments, the data for faces faces, vertices vertices, and the color data facevertexcdata are returned in separate arrays instead of a single structure.
If called with no output argument, the end-caps are drawn directly in the
current figure with the patch command.
See also: isosurface, isonormals, patch.
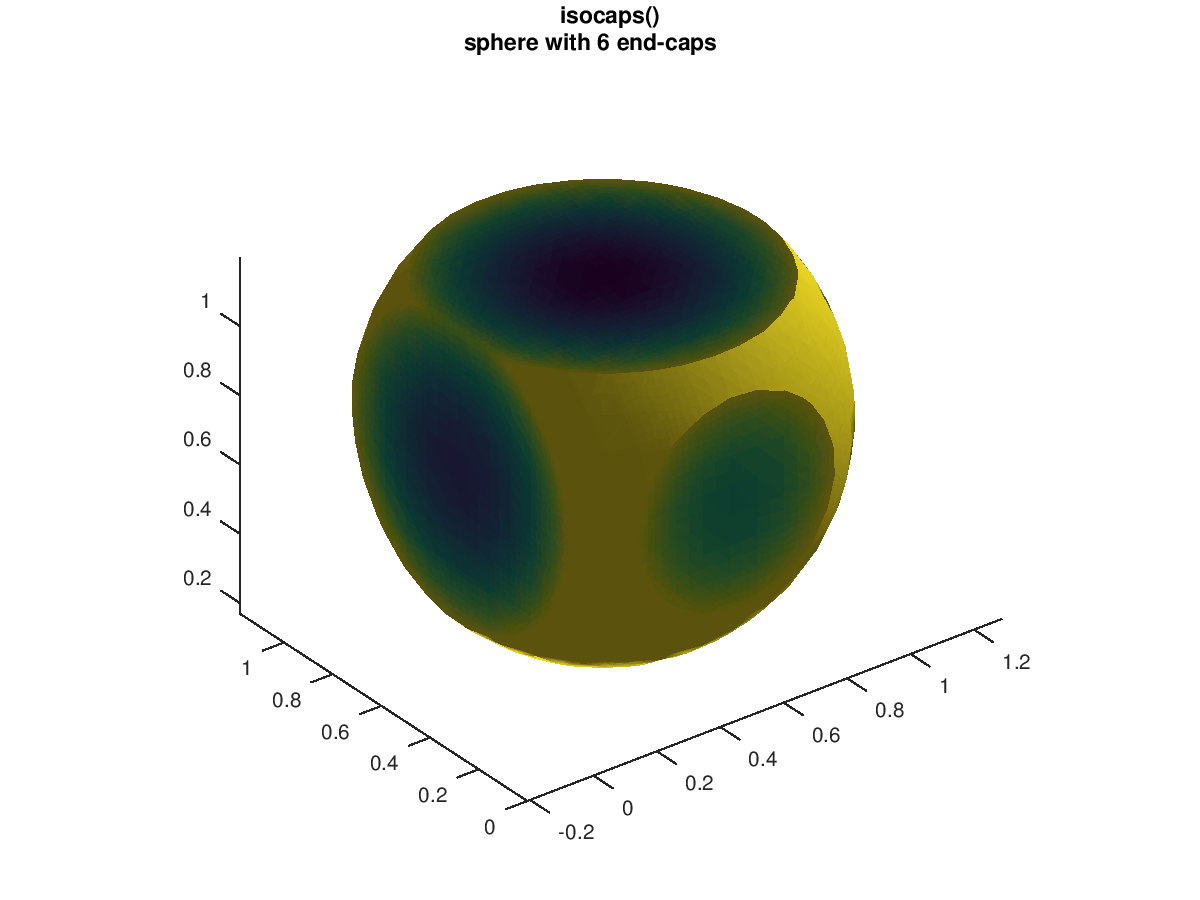
The following code
 isoval = .4;
 lin = linspace (0, 1.2, 15);
 [x, y, z] = meshgrid (lin, lin, lin);
 v = abs ((x-.45).^2 + (y-.55).^2 + (z-.8).^2);
 hf = clf;
 ha = axes;
 view (3);  box off;
 fvc_iso = isosurface (x, y, z, v, isoval);
 cmap = get (hf, "Colormap");
 p_iso = patch (fvc_iso, "FaceLighting", "gouraud", ...
                "FaceColor", cmap(end,:), "EdgeColor", "none");
 isonormals (x, y, z, v, p_iso);
 fvc_xmin = isocaps (x, y, z, v, isoval, "xmin", "b");
 patch (fvc_xmin, "FaceColor", "interp", "EdgeColor", "none", ...
        "FaceLighting", "gouraud", ...
        "VertexNormals", repmat([-1 0 0], size (fvc_xmin.vertices, 1), 1));
 fvc_ymin = isocaps (x, y, z, v, isoval, "ymin", "b");
 patch (fvc_ymin, "FaceColor", "interp", "EdgeColor", "none", ...
        "FaceLighting", "gouraud", ...
        "VertexNormals", repmat([0 -1 0], size (fvc_ymin.vertices, 1), 1));
 fvc_zmax = isocaps (x, y, z, v, isoval, "zmax", "b");
 patch (fvc_zmax, "FaceColor", "interp", "EdgeColor", "none", ...
        "FaceLighting", "gouraud", ...
        "VertexNormals", repmat([0 -1 0], size (fvc_zmax.vertices, 1), 1));
 axis equal;
 light ();
 title ({"isocaps()", "sphere with 6 end-caps"});
Produces the following figure
| Figure 1 |
|---|
 |
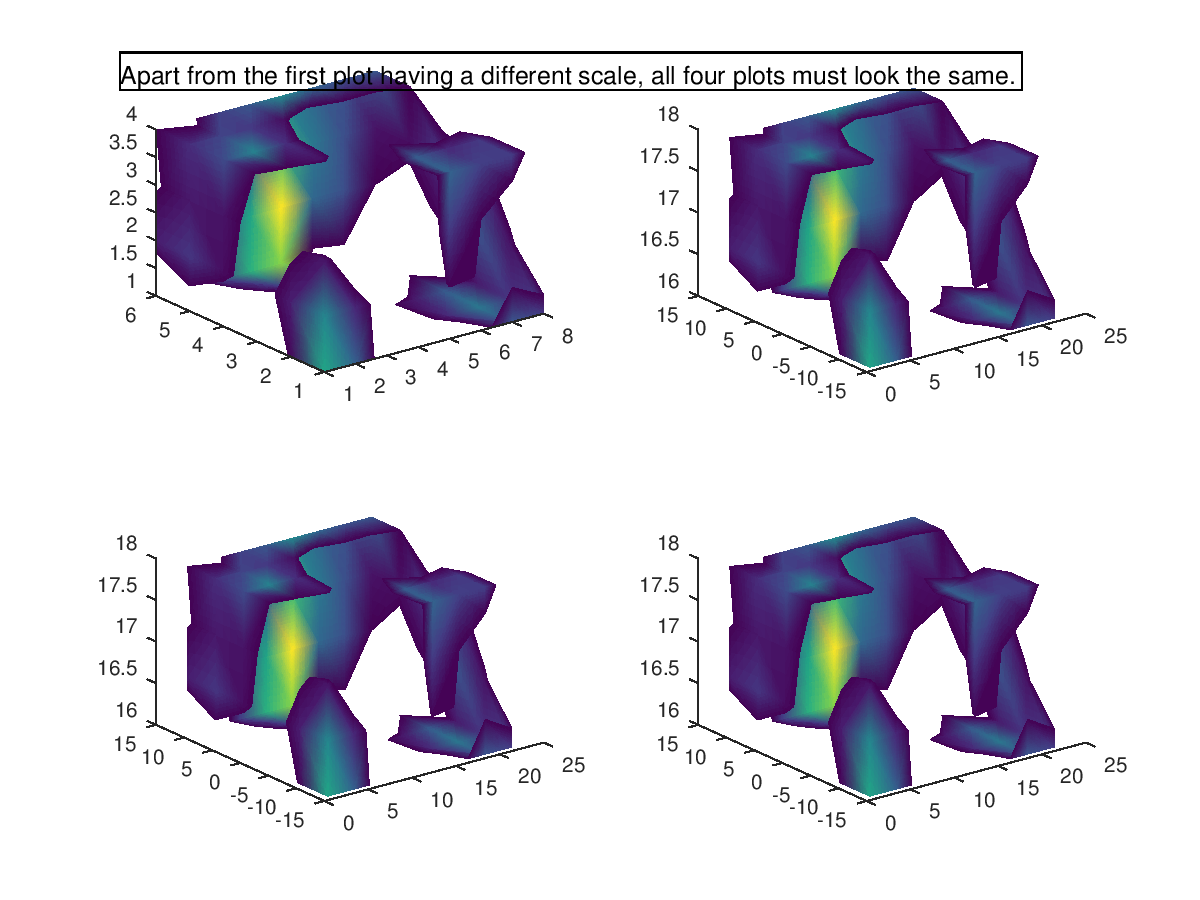
The following code
 v = smooth3 (rand (6, 8, 4));
 isoval = .5;
 x = 1:3:22;  y = -14:5:11;  z = linspace (16, 18, 4);
 [xx, yy, zz] = meshgrid (x, y, z);
 clf;
 ## two arguments, no output
 subplot (2, 2, 1);
  isocaps (v, isoval);
  view (3);
 ## five arguments, no output (x, y, z are vectors)
 subplot (2, 2, 2);
  isocaps (x, y, z, v, isoval);
  view (3);
 ## five arguments, no output (x, y, z are matrices)
 subplot (2, 2, 3);
  isocaps (xx, yy, zz, v, isoval);
  view (3);
 ## five arguments, no output (mixed x, y, z)
 subplot (2, 2, 4);
  isocaps (x, yy, z, v, isoval);
  view (3);

 annotation ("textbox", [0.1 0.9 0.9 0.1], ...
     "String", ["Apart from the first plot having a different scale, " ...
     "all four plots must look the same."], ...
     "HorizontalAlignment", "left", ...
     "FontSize", 12);
Produces the following figure
| Figure 1 |
|---|
 |
Package: octave