
|
Octave-Forge - Extra packages for GNU Octave |
| Home · Packages · Developers · Documentation · FAQ · Bugs · Mailing Lists · Links · Code |
|
|
Octave-Forge - Extra packages for GNU Octave |
| Home · Packages · Developers · Documentation · FAQ · Bugs · Mailing Lists · Links · Code |
Calculate normals to an isosurface.
The vertex normals vn are calculated from the gradient of the 3-dimensional array val (size: lxmxn) with the data for an isosurface geometry. The normals point towards lower values in val.
If called with one output argument vn and the second input argument
vert holds the vertices of an isosurface, the normals vn are
calculated at the vertices vert on a grid given by
[x, y, z] = meshgrid (1:l, 1:m, 1:n). The output argument
vn has the same size as vert and can be used to set the
"VertexNormals" property of the corresponding patch.
If called with further input arguments x, y, and z which are 3-dimensional arrays with the same size as val, the volume data is taken at these points. Instead of the vertex data vert, a patch handle hp can be passed to this function.
If the last input argument is the string "negate", compute the
reverse vector normals of an isosurface geometry (i.e., pointed towards
higher values in val).
If no output argument is given, the property "VertexNormals" of
the patch associated with the patch handle hp is changed directly.
See also: isosurface, isocolors, smooth3.
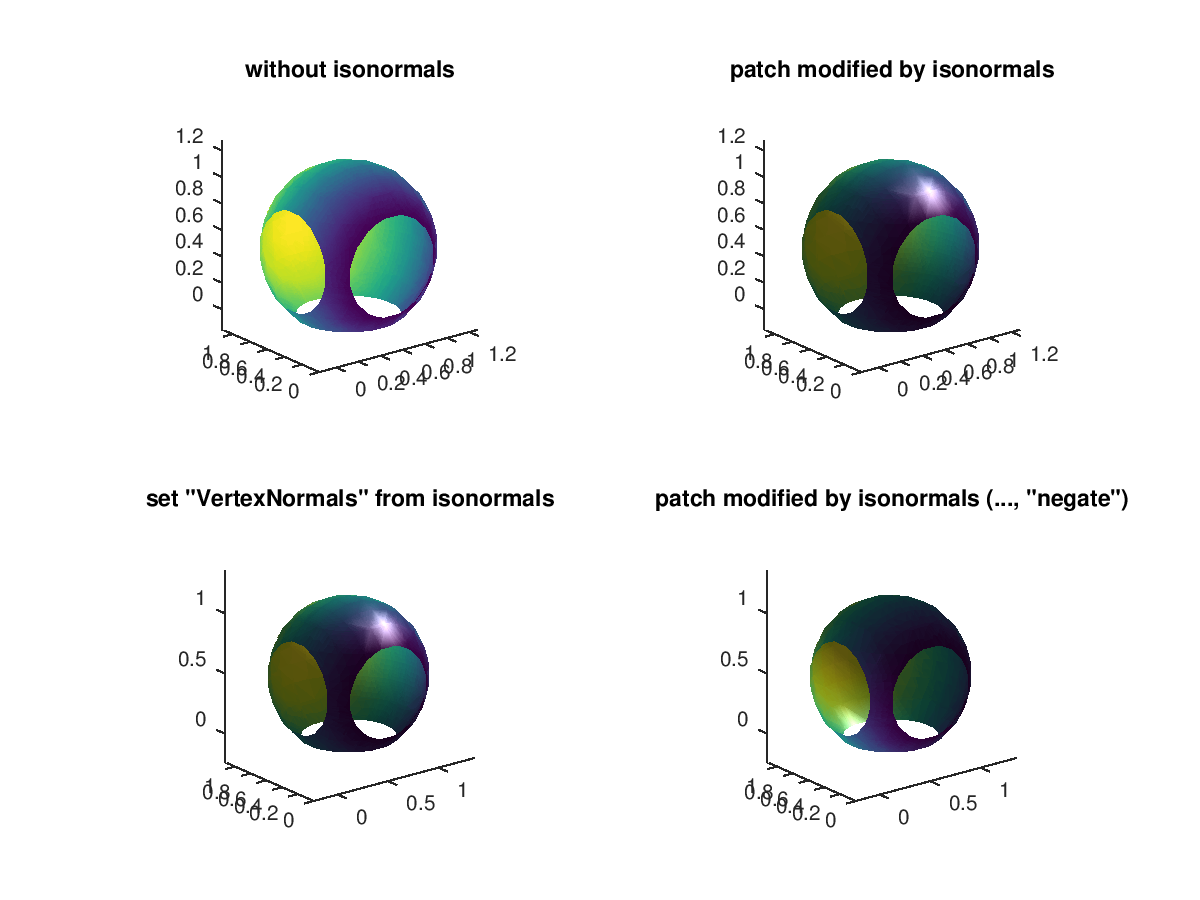
The following code
 function isofinish (hp)
   axis equal;
   set (hp, "VertexNormals", -get (hp, "VertexNormals"));  # Revert normals
   shading interp;
   lighting gouraud;
   set (hp, "BackFaceLighting", "lit");
   light ();
 endfunction

 N = 15;    # Increase number of vertices in each direction
 iso = .4;  # Change isovalue to .1 to display a sphere
 lin = linspace (0, 2, N);
 [x, y, z] = meshgrid (lin, lin, lin);
 val = (x-.5).^2 + (y-.5).^2 + (z-.5).^2;
 clf;

 subplot (2,2,1);
  view (-38, 20);
  [fac, vert, cdat] = isosurface (x, y, z, val, iso, y);
  hp = patch ("Faces", fac, "Vertices", vert, "FaceVertexCData", cdat);
  title ("without isonormals");
  isofinish (hp);
  set (hp, "VertexNormalsMode", "auto");  # for Matlab compatibility

 subplot (2,2,2);
  view (-38, 20);
  hp = patch ("Faces", fac, "Vertices", vert, "FaceVertexCData", cdat);
  title ("patch modified by isonormals");
  isonormals (x, y, z, val, hp);  # Directly modify patch
  isofinish (hp);

 subplot (2,2,3);
  view (-38, 20);
  hp = patch ("Faces", fac, "Vertices", vert, "FaceVertexCData", cdat);
  vn = isonormals (x, y, z, val, vert);  # Compute normals of isosurface
  set (hp, "VertexNormals", vn);         # Manually set vertex normals
  title ('set "VertexNormals" from isonormals');
  isofinish (hp);

 subplot (2,2,4);
  view (-38, 20);
  hp = patch ("Faces", fac, "Vertices", vert, "FaceVertexCData", cdat);
  isonormals (x, y, z, val, hp, "negate");  # Use reverse directly
  title ('patch modified by isonormals (..., "negate")');
  isofinish (hp);
Produces the following figure
| Figure 1 |
|---|
 |
Package: octave