
|
Octave-Forge - Extra packages for GNU Octave |
| Home · Packages · Developers · Documentation · FAQ · Bugs · Mailing Lists · Links · Code |
|
|
Octave-Forge - Extra packages for GNU Octave |
| Home · Packages · Developers · Documentation · FAQ · Bugs · Mailing Lists · Links · Code |
Display a legend for the current axes using the specified strings as labels.
Legend entries may be specified as individual character string arguments, a character array, or a cell array of character strings.
If the first argument hax is an axes handle, then plot into this axis,
rather than the current axes returned by gca. If the handles,
hobjs, are not specified then the legend’s strings will be associated
with the axes’ descendants. legend works on line graphs,
bar graphs, etc. A plot must exist before legend is called.
The optional parameter pos specifies the location of the legend as follows:
| pos | location of the legend | |
|---|---|---|
| north | center top | |
| south | center bottom | |
| east | right center | |
| west | left center | |
| northeast | right top (default) | |
| northwest | left top | |
| southeast | right bottom | |
| southwest | left bottom | |
| outside | can be appended to any location string |
The optional parameter orient determines if the key elements are
placed vertically or horizontally. The allowed values are
"vertical" (default) or "horizontal".
The following customizations are available using option:
"show"Show legend on the plot
"hide"Hide legend on the plot
"toggle"Toggles between "hide" and "show"
"boxon"Show a box around legend (default)
"boxoff"Hide the box around legend
"right"Place label text to the right of the keys (default)
"left"Place label text to the left of the keys
"off"Delete the legend object
The optional output values are
The graphics handle of the legend object.
Graphics handles to the text and line objects which make up the legend.
Graphics handles to the plot objects which were used in making the legend.
A cell array of strings of the labels in the legend.
The legend label text is either provided in the call to legend or
is taken from the DisplayName property of graphics objects. If no
labels or DisplayNames are available, then the label text is simply
"data1", "data2", …, "dataN".
Implementation Note: A legend is implemented as an additional axes object
of the current figure with the "tag" set to "legend".
Properties of the legend object may be manipulated directly by using
set.
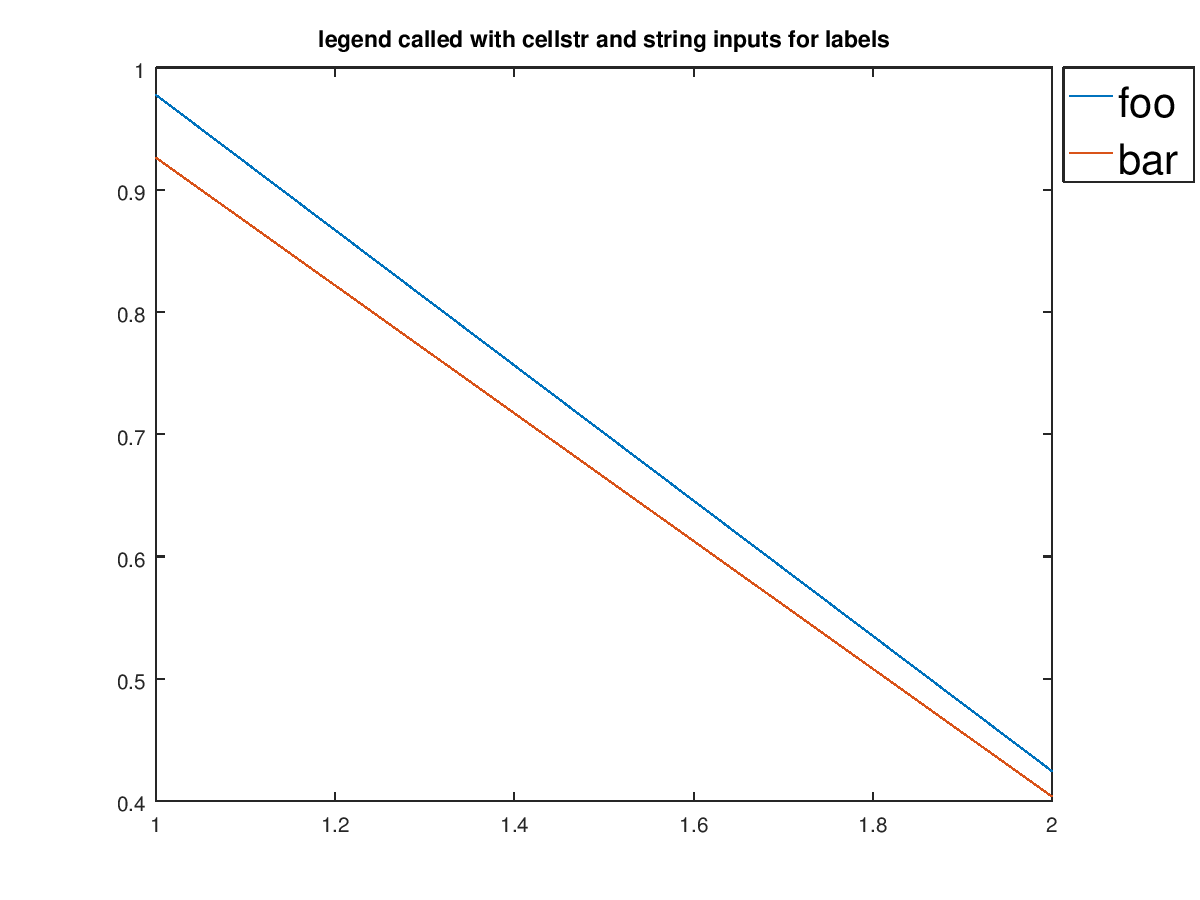
The following code
 clf;
 plot (rand (2));
 title ("legend called with cellstr and string inputs for labels");
 h = legend ({"foo"}, "bar");
 legend (h, "location", "northeastoutside");
 set (h, "fontsize", 20);
Produces the following figure
| Figure 1 |
|---|
 |
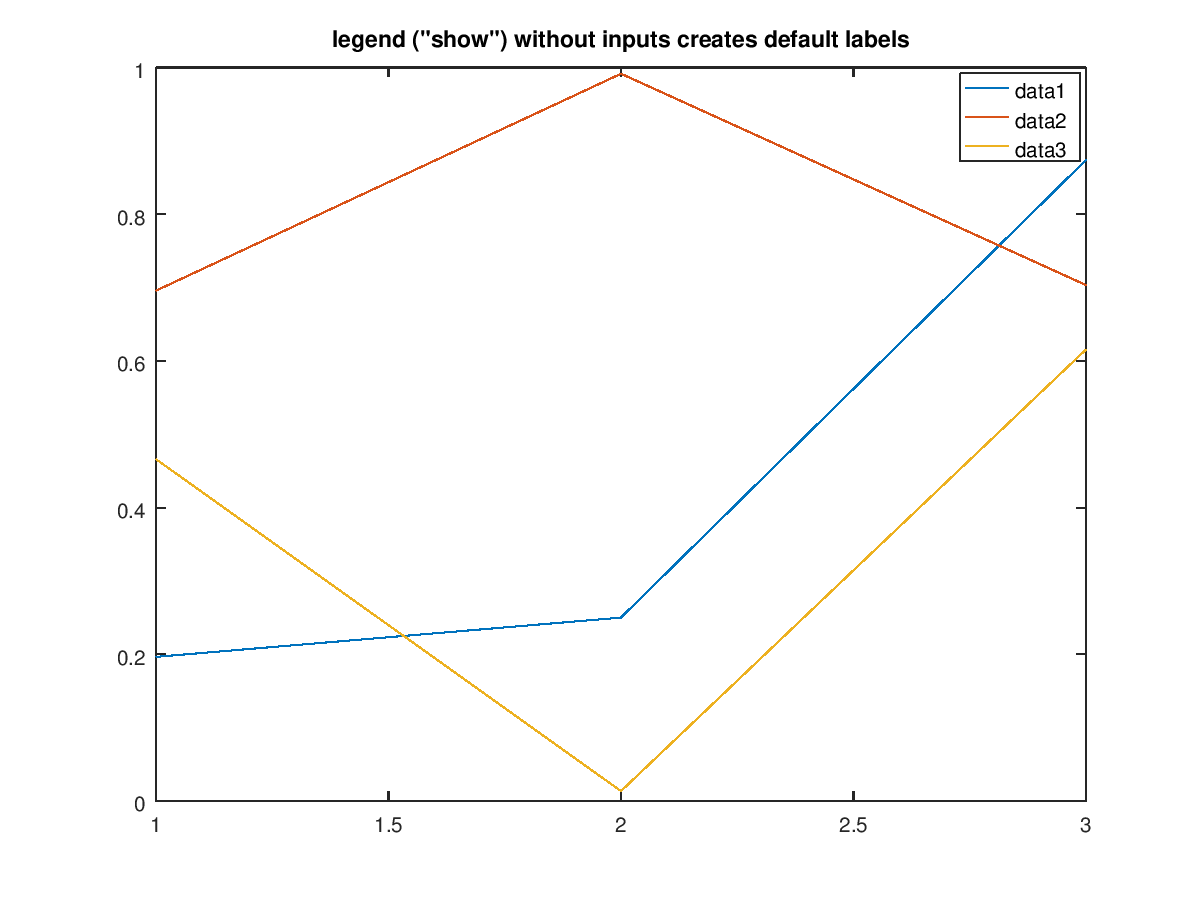
The following code
 clf;
 plot (rand (3));
 title ('legend ("show") without inputs creates default labels');
 h = legend ("show");
Produces the following figure
| Figure 1 |
|---|
 |
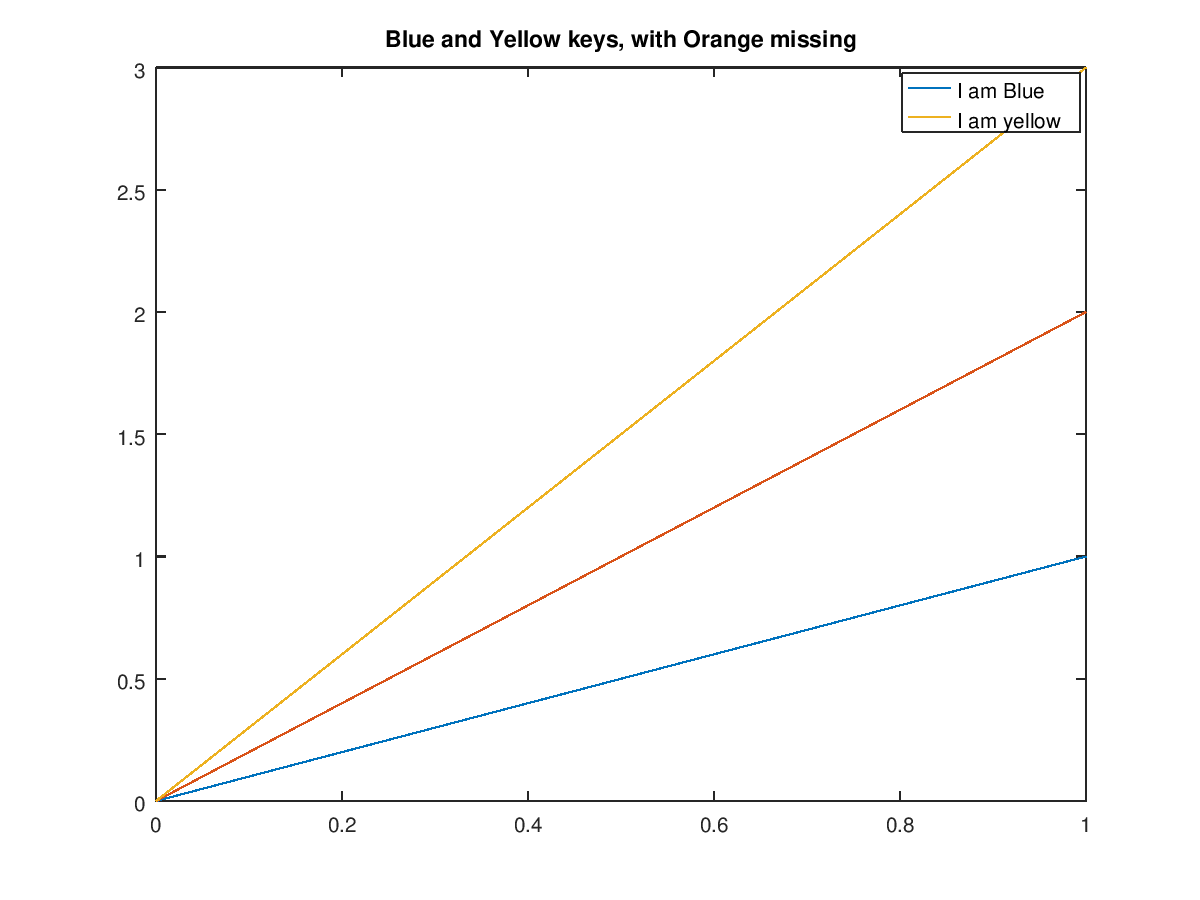
The following code
 clf;
 x = 0:1;
 plot (x,x,";I am Blue;", x,2*x, x,3*x,";I am yellow;");
 h = legend ("location", "northeastoutside");
 ## Placing legend inside should return axes to original size
 legend (h, "location", "northeast");
 title ("Blue and Yellow keys, with Orange missing");
Produces the following figure
| Figure 1 |
|---|
 |
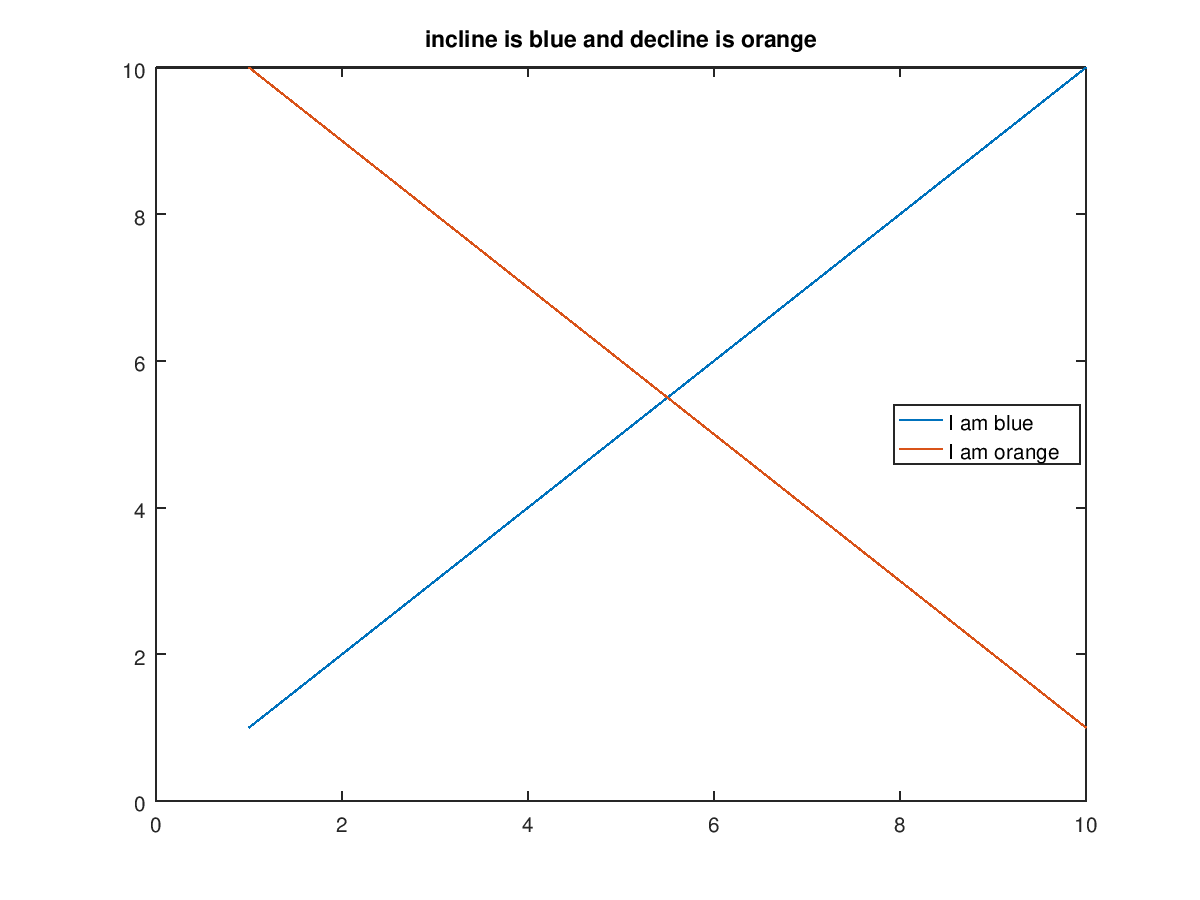
The following code
 clf;
 plot (1:10, 1:10, 1:10, fliplr (1:10));
 title ("incline is blue and decline is orange");
 legend ({"I am blue", "I am orange"}, "location", "east");
 legend hide
 legend show
Produces the following figure
| Figure 1 |
|---|
 |
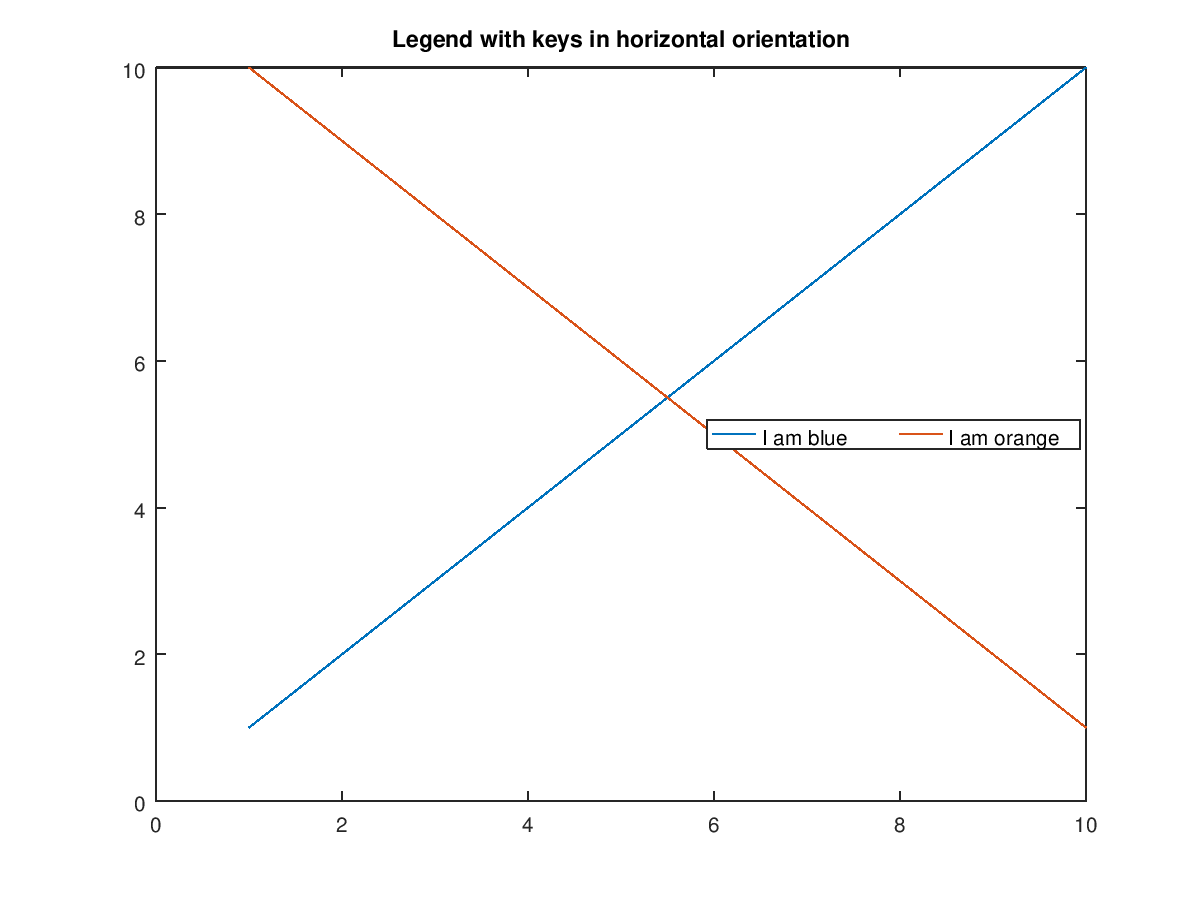
The following code
 clf;
 plot (1:10, 1:10, 1:10, fliplr (1:10));
 title ("Legend with keys in horizontal orientation");
 legend ({"I am blue", "I am orange"}, ...
         "location", "east", "orientation", "horizontal");
 legend boxoff
 legend boxon
Produces the following figure
| Figure 1 |
|---|
 |
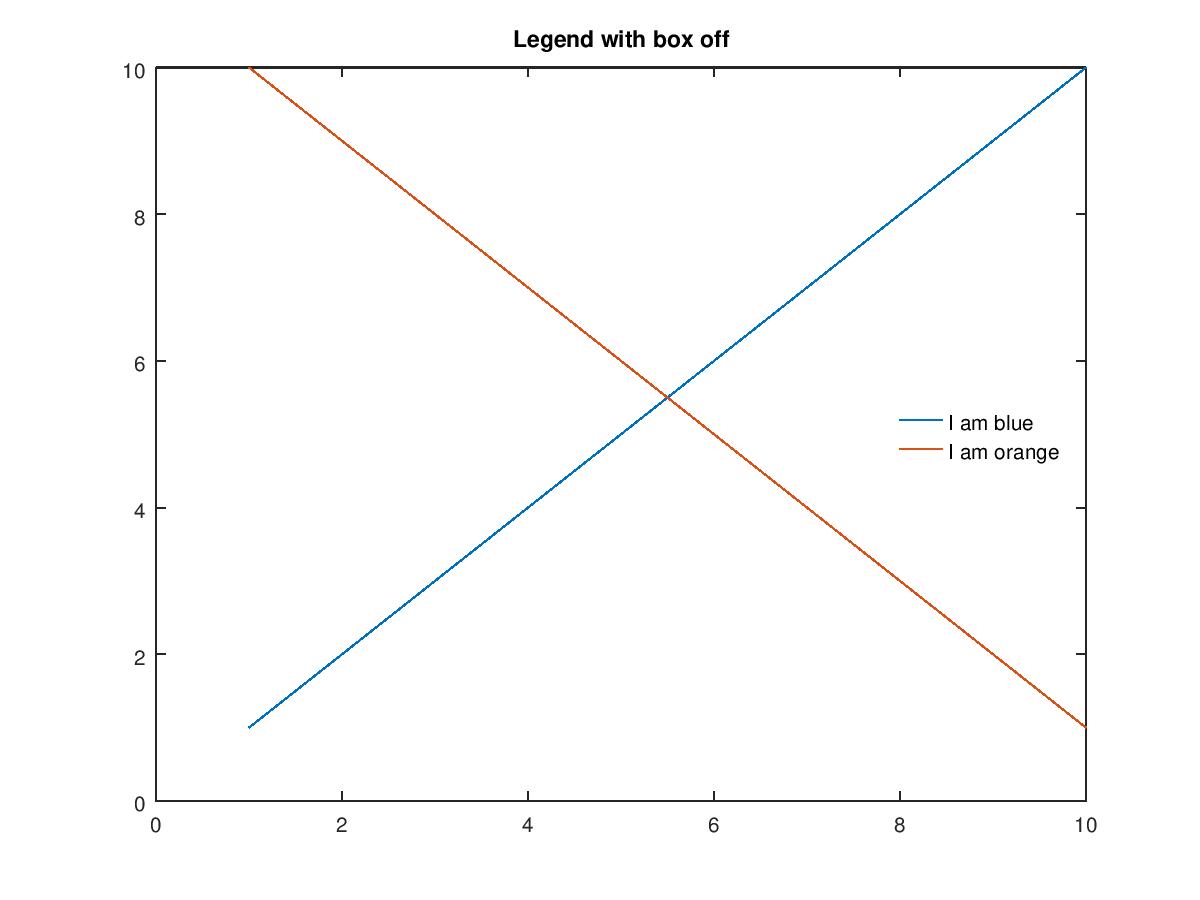
The following code
 clf;
 plot (1:10, 1:10, 1:10, fliplr (1:10));
 title ("Legend with box off");
 legend ({"I am blue", "I am orange"}, "location", "east");
 legend boxoff
Produces the following figure
| Figure 1 |
|---|
 |
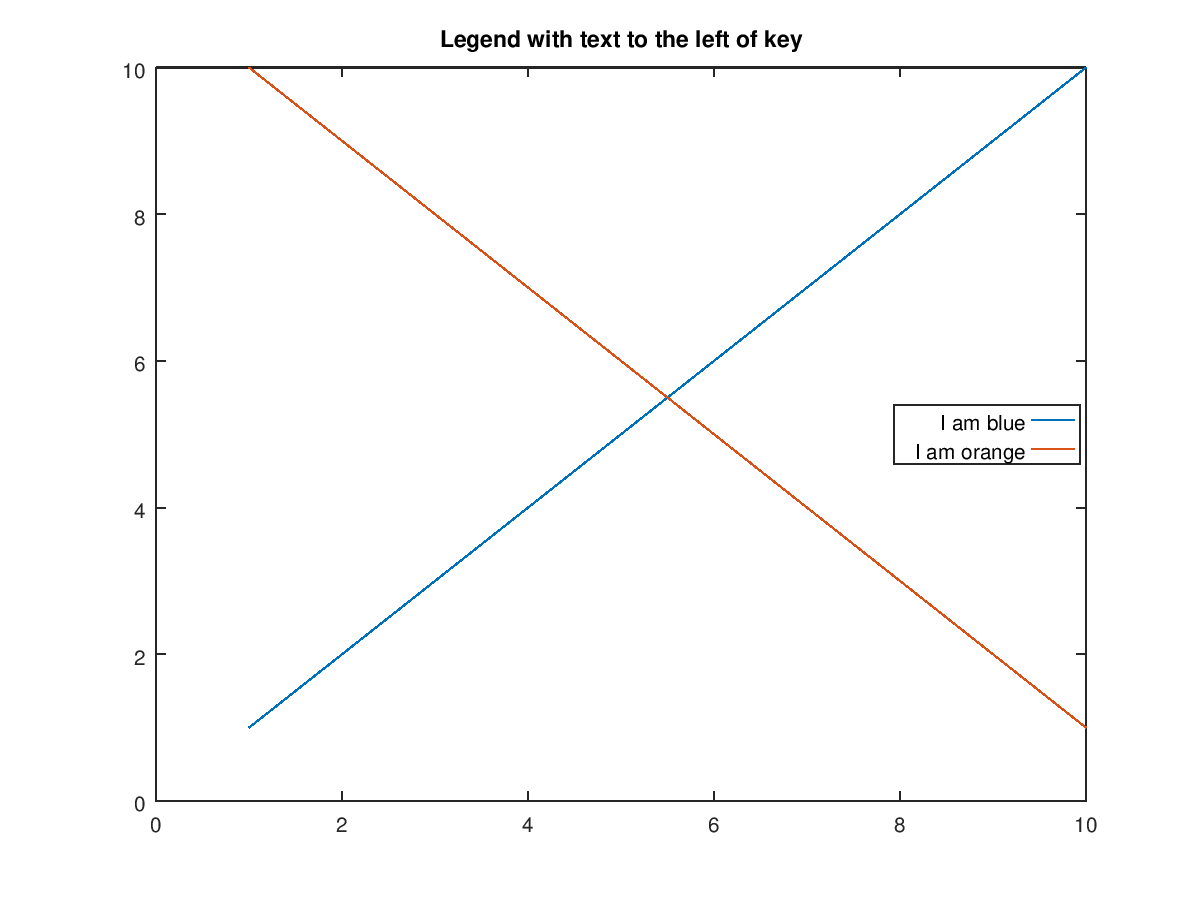
The following code
 clf;
 plot (1:10, 1:10, 1:10, fliplr (1:10));
 title ("Legend with text to the left of key");
 legend ({"I am blue", "I am orange"}, "location", "east");
 legend left
Produces the following figure
| Figure 1 |
|---|
 |
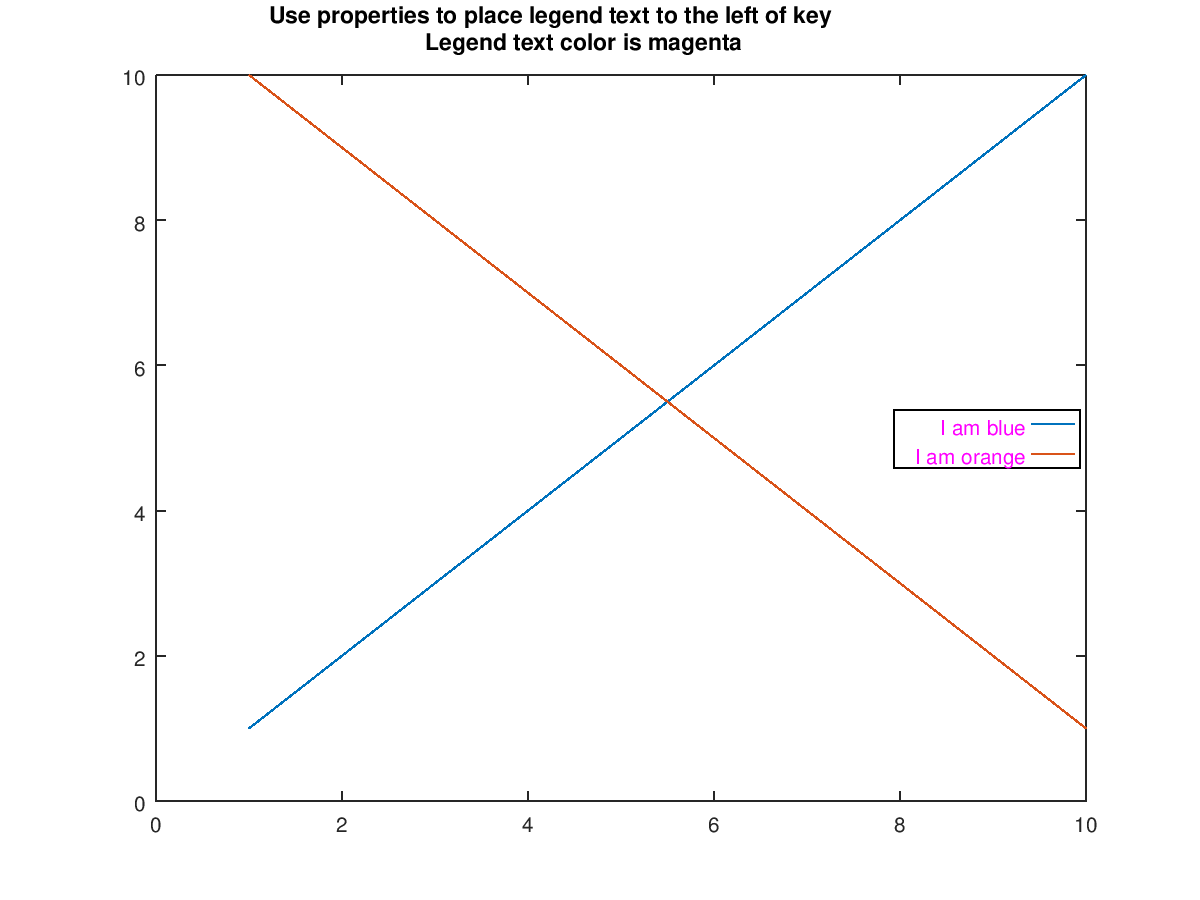
The following code
 clf;
 plot (1:10, 1:10, 1:10, fliplr (1:10));
 title ({"Use properties to place legend text to the left of key", ...
         "Legend text color is magenta"});
 h = legend ({"I am blue", "I am orange"}, "location", "east");
 legend ("right");
 set (h, "textposition", "left");
 set (h, "textcolor", [1 0 1]);
Produces the following figure
| Figure 1 |
|---|
 |
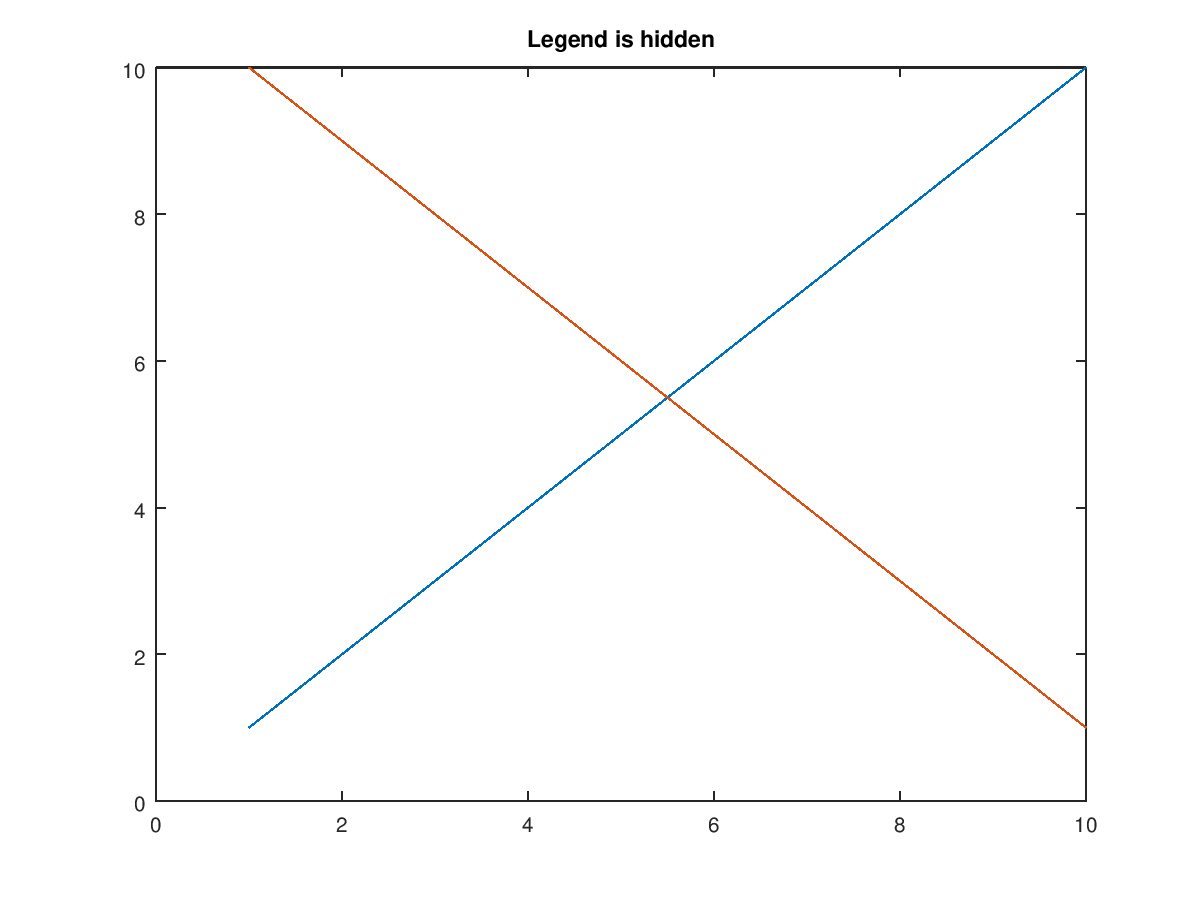
The following code
 clf;
 plot (1:10, 1:10, 1:10, fliplr (1:10));
 title ("Legend is hidden");
 legend ({"I am blue", "I am orange"}, "location", "east");
 legend hide
Produces the following figure
| Figure 1 |
|---|
 |
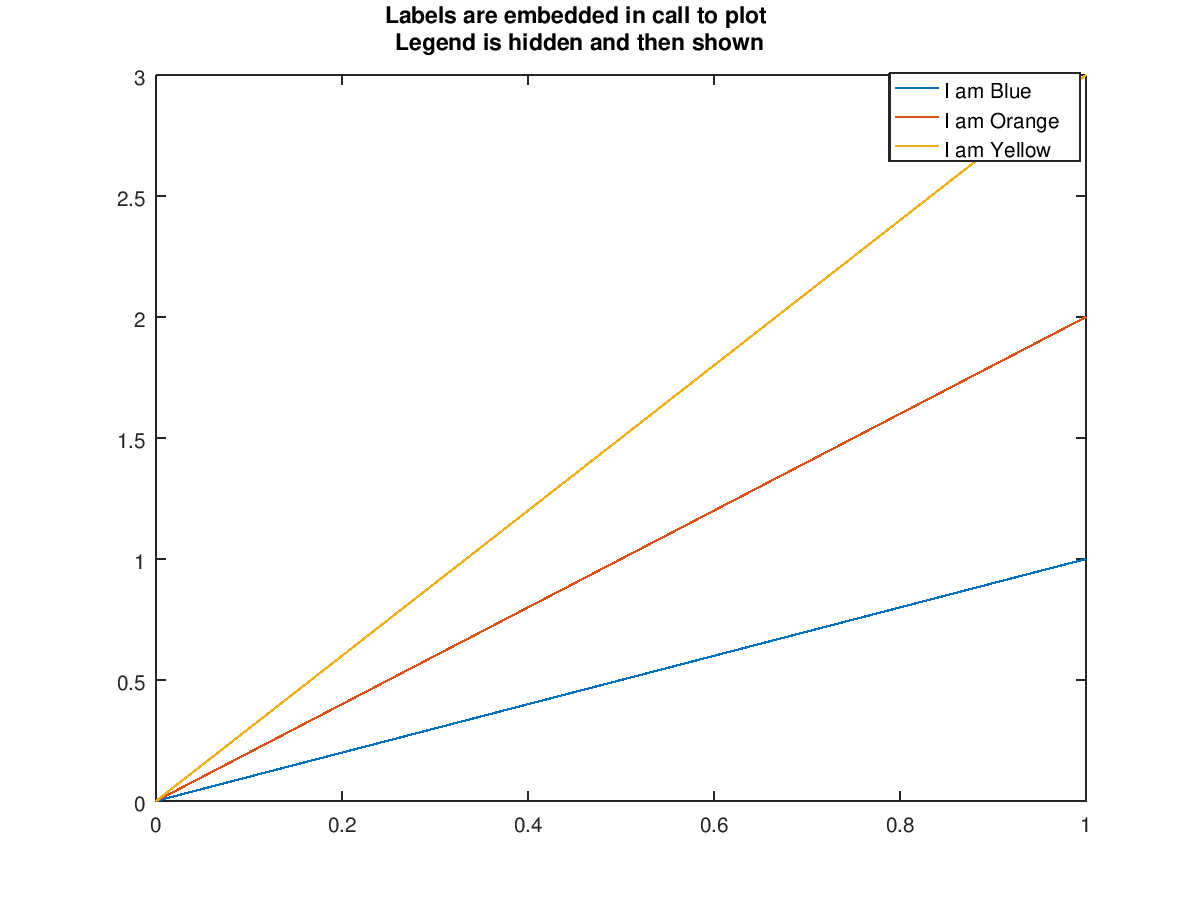
The following code
 clf;
 x = 0:1;
 plot (x,x,";I am Blue;", x,2*x,";I am Orange;", x,3*x,";I am Yellow;");
 title ({"Labels are embedded in call to plot", ...
         "Legend is hidden and then shown"});
 legend boxon
 legend hide
 legend show
Produces the following figure
| Figure 1 |
|---|
 |
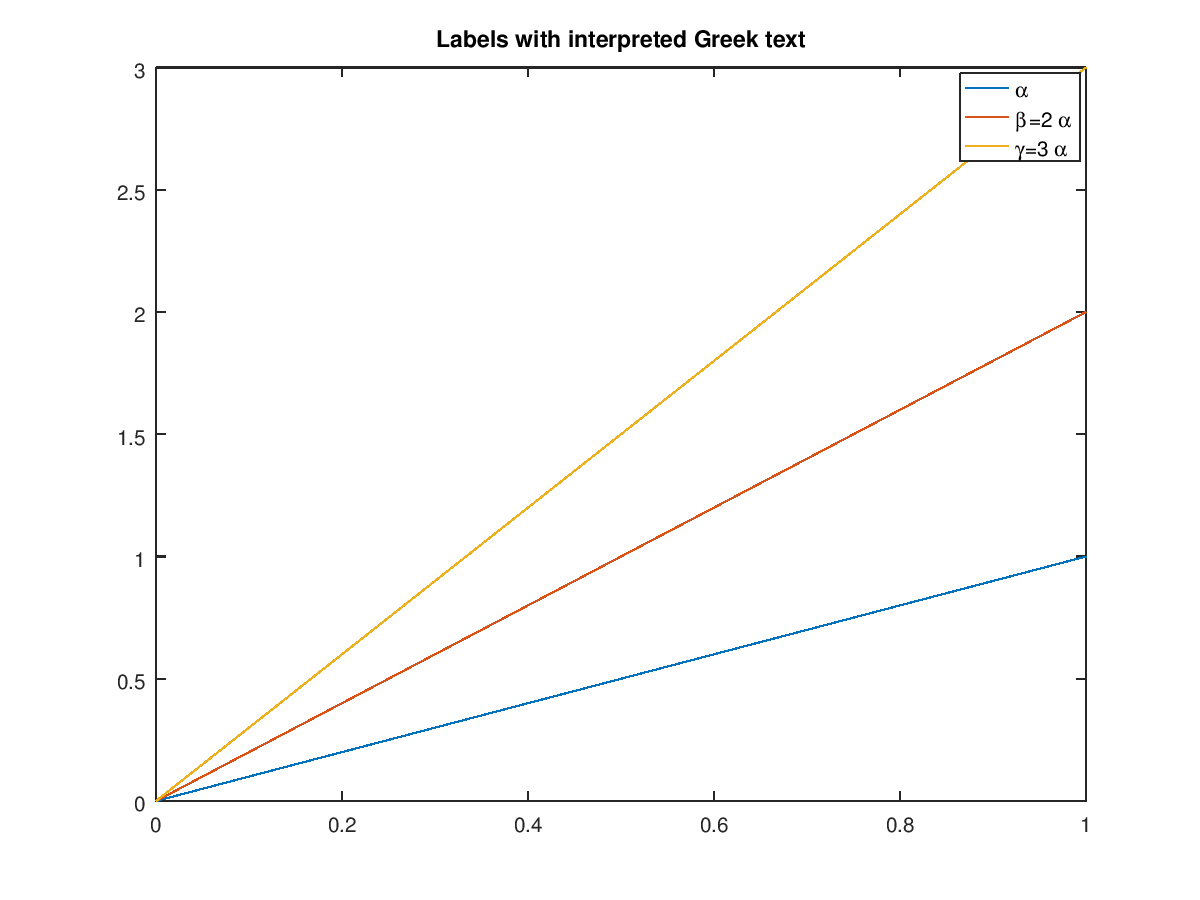
The following code
 clf;
 x = 0:1;
 plot (x,x,  x,2*x, x,3*x);
 title ("Labels with interpreted Greek text");
 h = legend ('\alpha', '\beta=2\alpha', '\gamma=3\alpha');
 set (h, "interpreter", "tex");
Produces the following figure
| Figure 1 |
|---|
 |
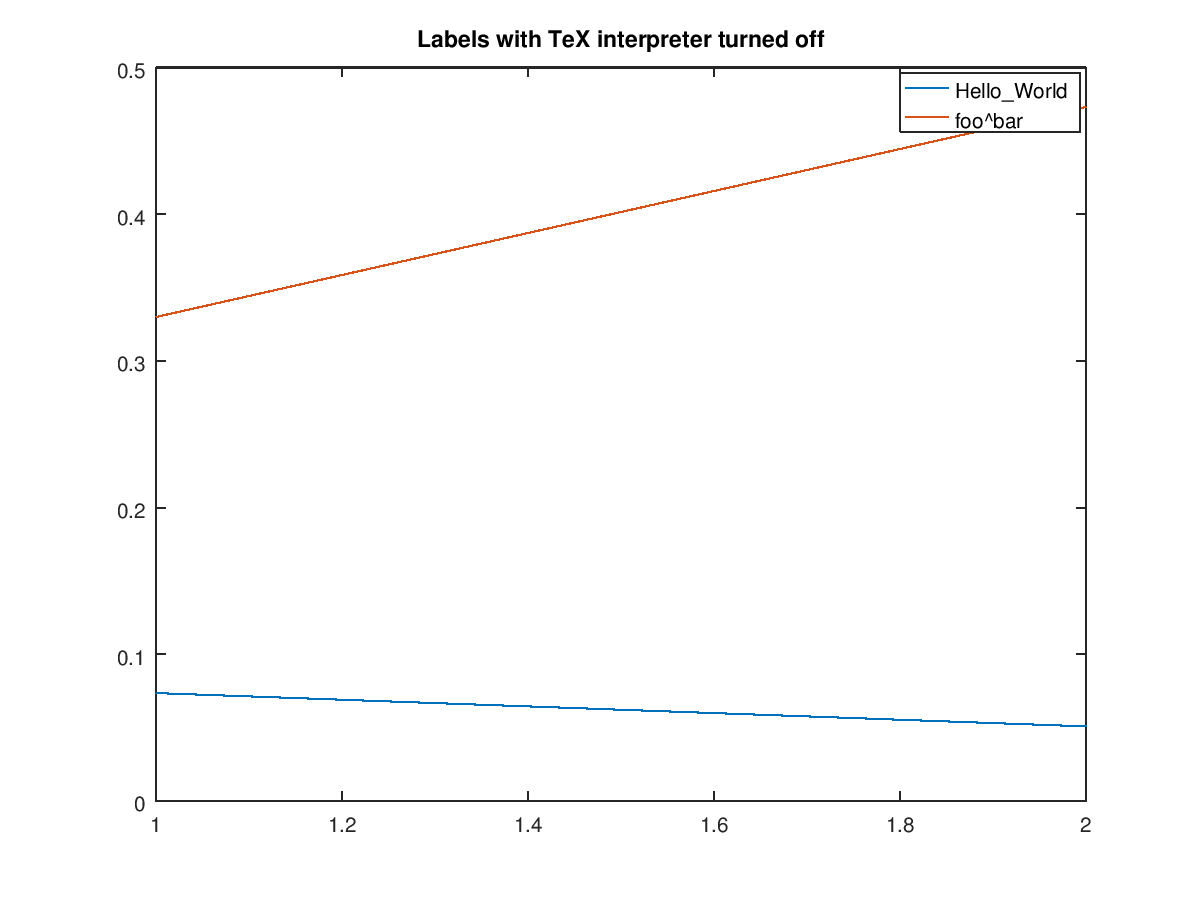
The following code
 clf;
 plot (rand (2));
 title ("Labels with TeX interpreter turned off");
 h = legend ("Hello_World", "foo^bar");
 set (h, "interpreter", "none");
Produces the following figure
| Figure 1 |
|---|
 |
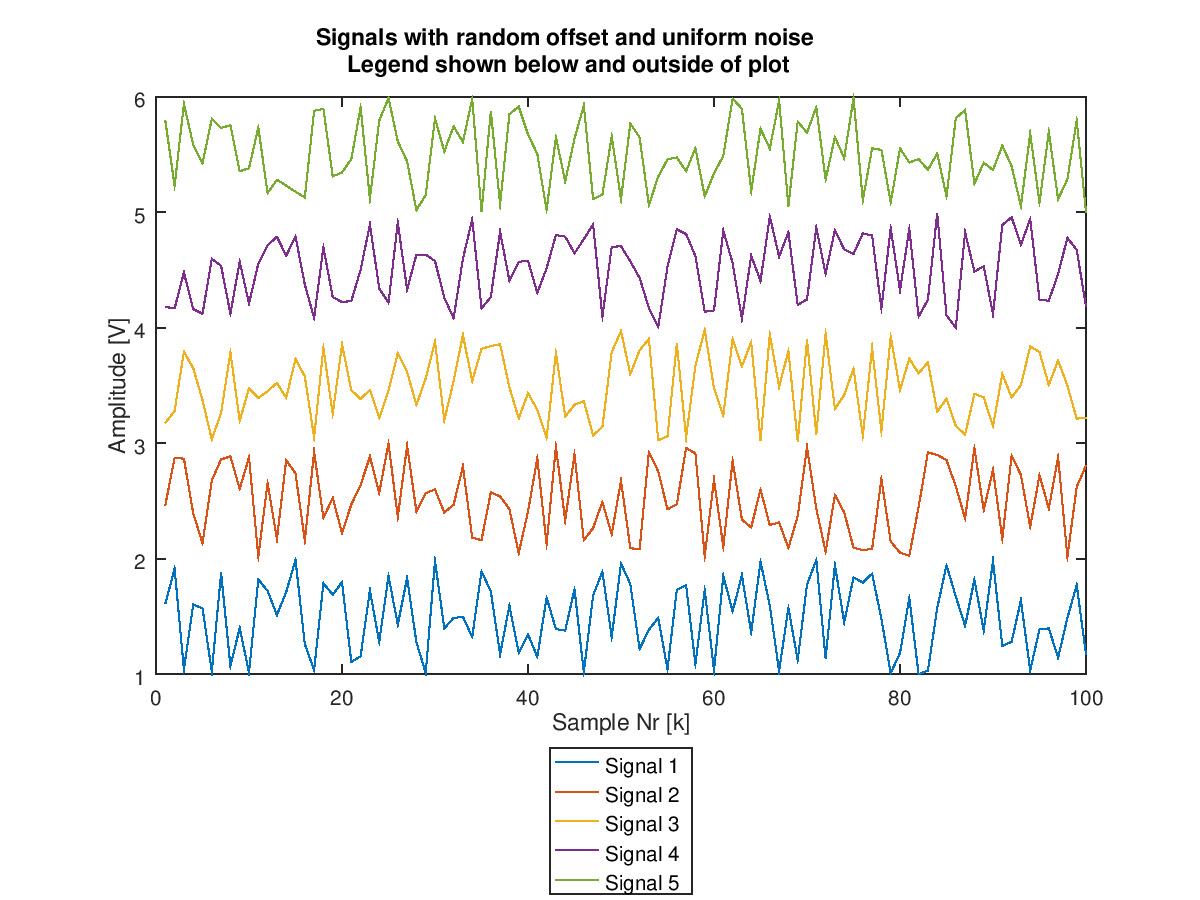
The following code
 clf;
 labels = {};
 colororder = get (gca, "colororder");
 for i = 1:5
   h = plot (1:100, i + rand (100,1)); hold on;
   set (h, "color", colororder(i,:));
   labels = {labels{:}, ["Signal ", num2str(i)]};
 endfor
 hold off;
 title ({"Signals with random offset and uniform noise";
         "Legend shown below and outside of plot"});
 xlabel ("Sample Nr [k]"); ylabel ("Amplitude [V]");
 legend (labels, "location", "southoutside");
Produces the following figure
| Figure 1 |
|---|
 |
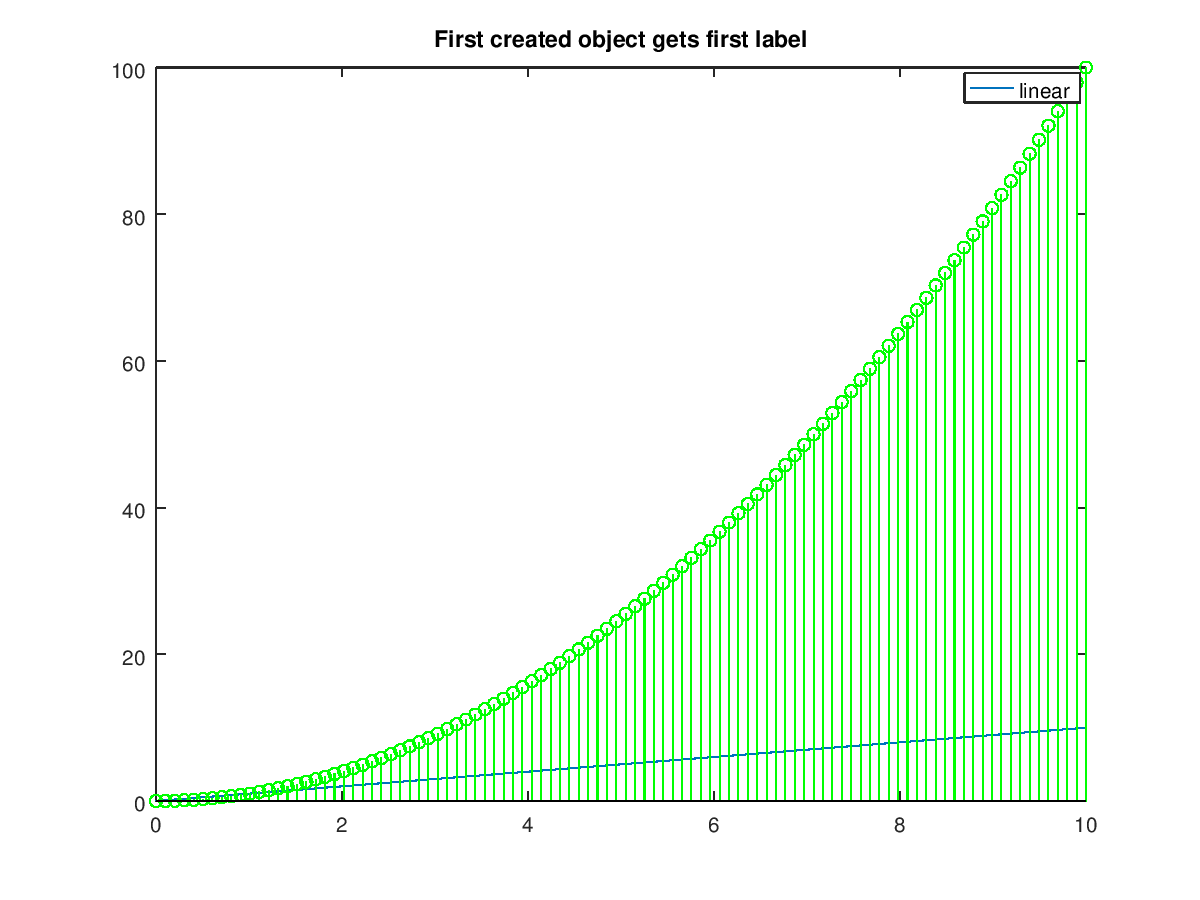
The following code
 clf;
 x = linspace (0, 10);
 plot (x, x);
 hold on;
 stem (x, x.^2, "g");
 title ("First created object gets first label");
 legend ("linear");
 hold off;
Produces the following figure
| Figure 1 |
|---|
 |
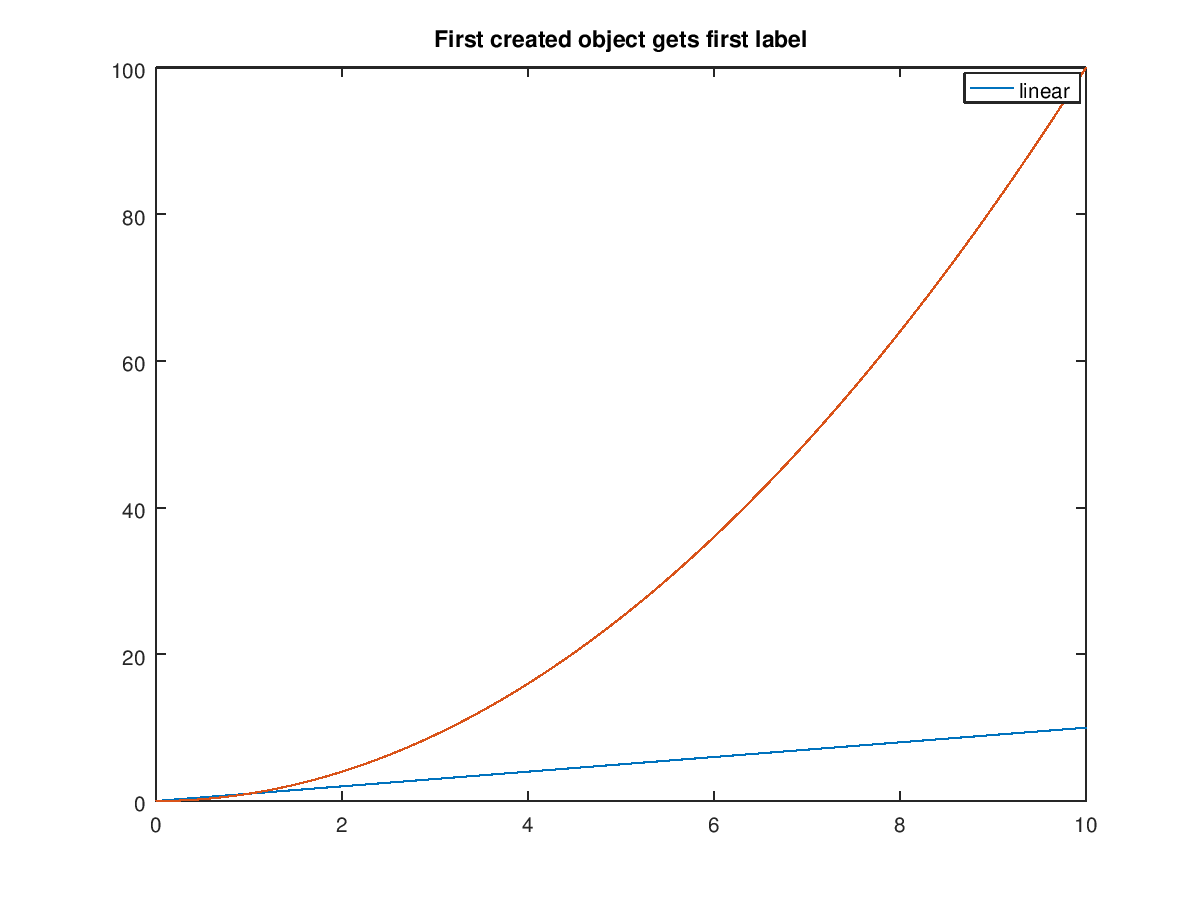
The following code
 clf;
 x = linspace (0, 10);
 plot (x, x, x, x.^2);
 title ("First created object gets first label");
 legend ("linear");
Produces the following figure
| Figure 1 |
|---|
 |
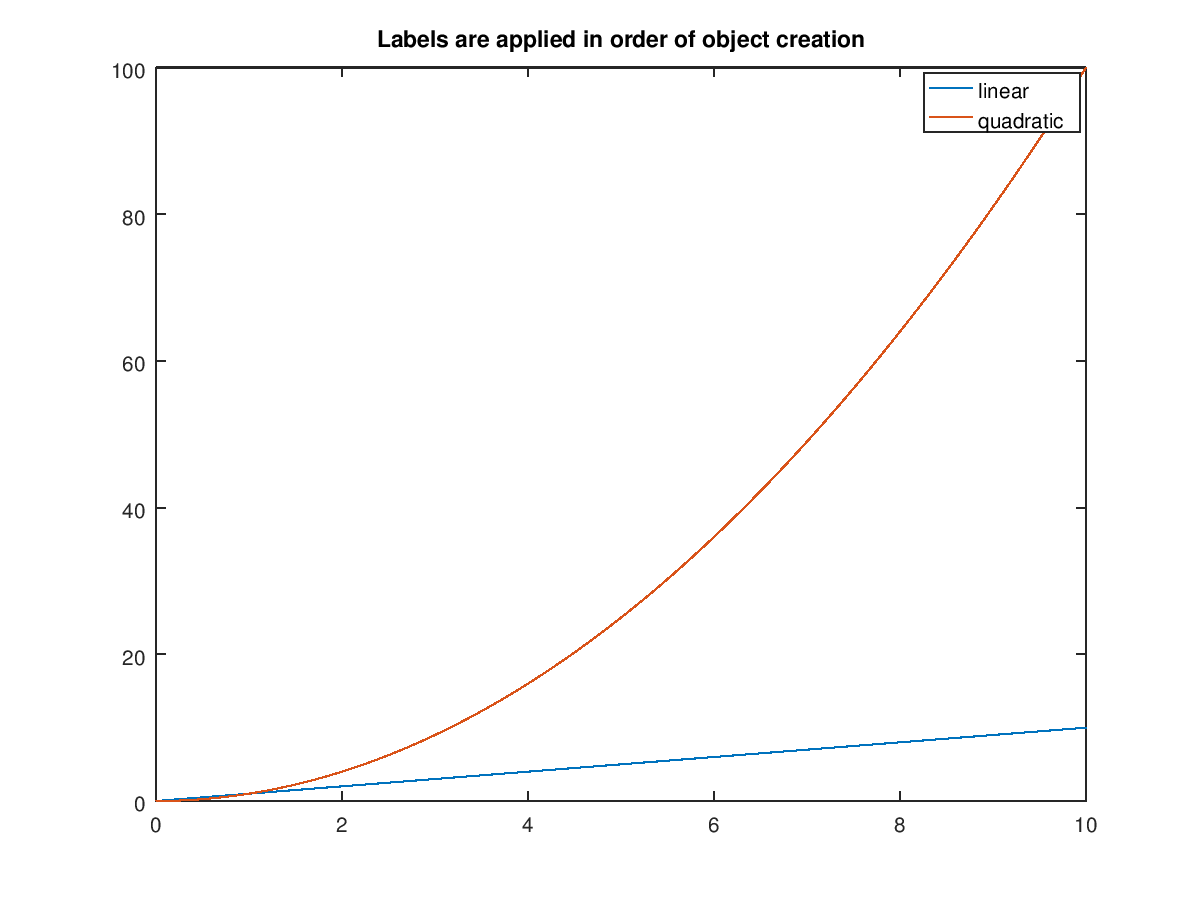
The following code
 clf;
 x = linspace (0, 10);
 plot (x, x, x, x.^2);
 title ("Labels are applied in order of object creation");
 legend ("linear", "quadratic");
Produces the following figure
| Figure 1 |
|---|
 |
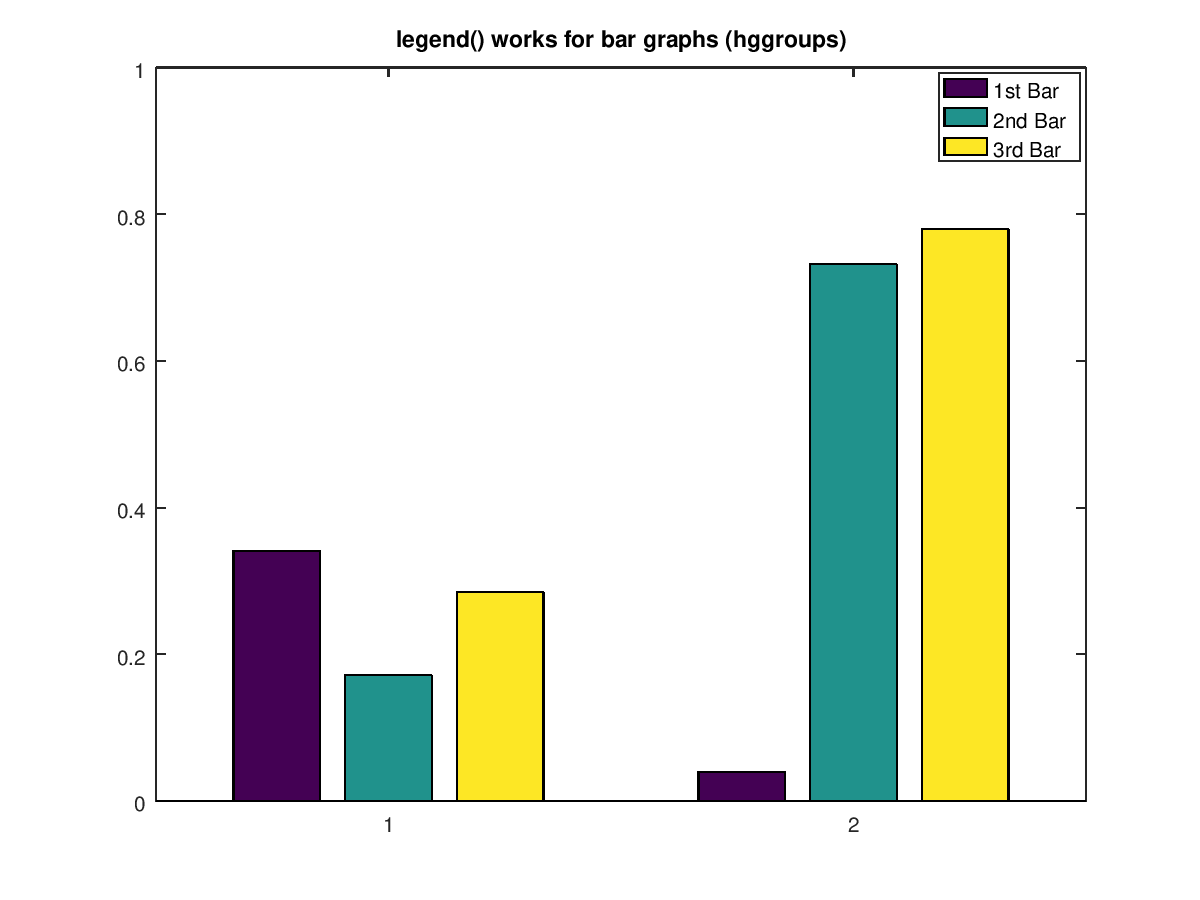
The following code
 clf;
 rand_2x3_data1 = [0.341447, 0.171220, 0.284370; 0.039773, 0.731725, 0.779382];
 bar (rand_2x3_data1);
 ylim ([0 1.0]);
 title ("legend() works for bar graphs (hggroups)");
 legend ({"1st Bar", "2nd Bar", "3rd Bar"});
Produces the following figure
| Figure 1 |
|---|
 |
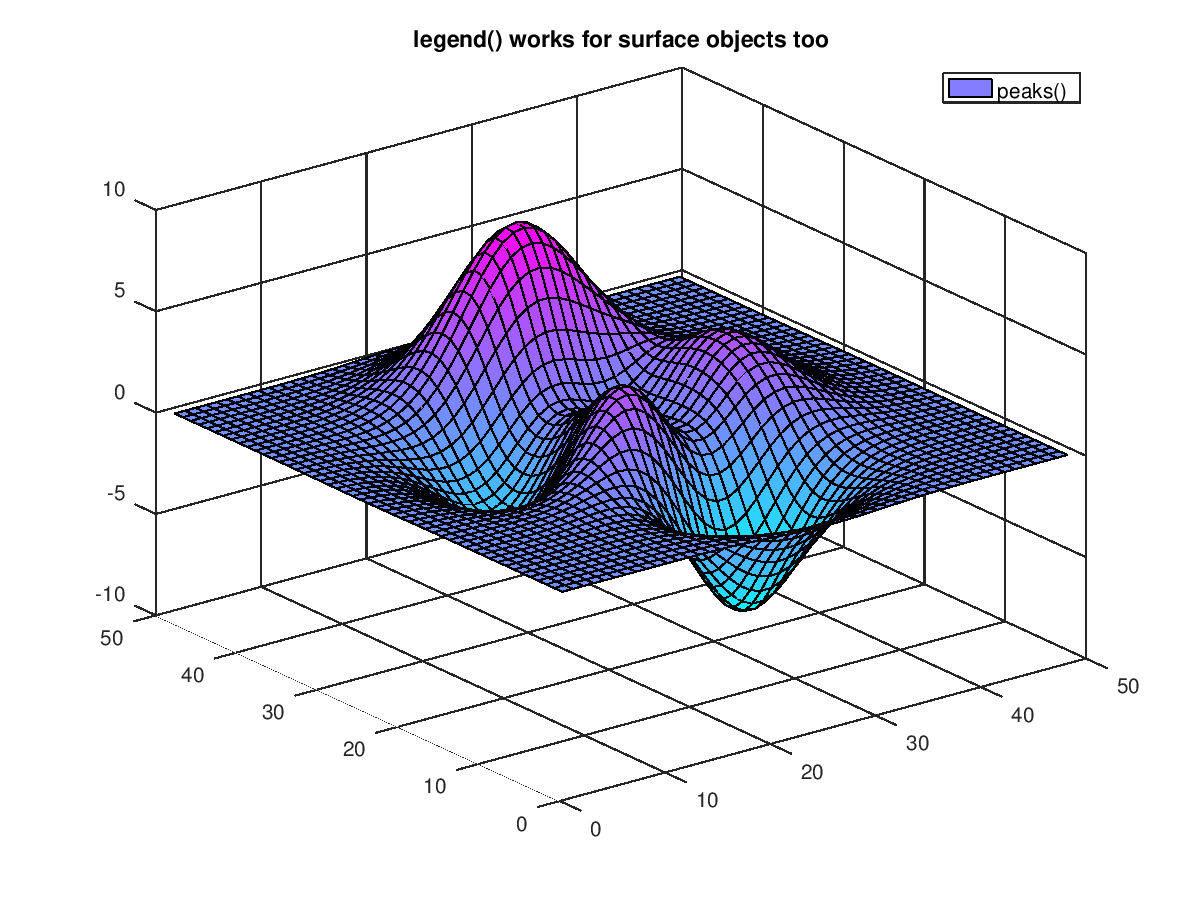
The following code
 clf;
 colormap (cool (64));
 surf (peaks ());
 legend ("peaks()");
 title ("legend() works for surface objects too");
Produces the following figure
| Figure 1 |
|---|
 |
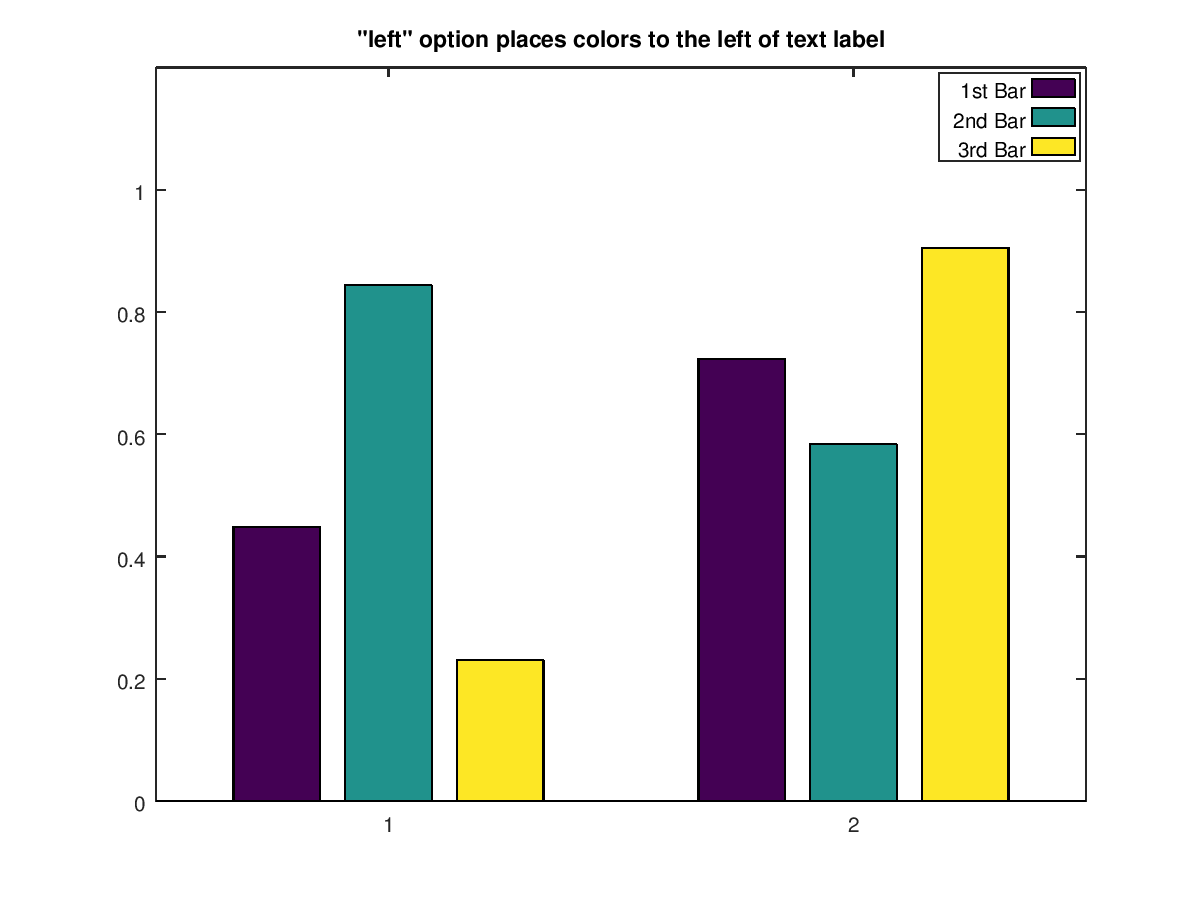
The following code
 clf reset;  # needed to undo colormap assignment in previous demo
 rand_2x3_data2 = [0.44804, 0.84368, 0.23012; 0.72311, 0.58335, 0.90531];
 bar (rand_2x3_data2);
 ylim ([0 1.2]);
 title ('"left" option places colors to the left of text label');
 legend ("1st Bar", "2nd Bar", "3rd Bar");
 legend left;
Produces the following figure
| Figure 1 |
|---|
 |
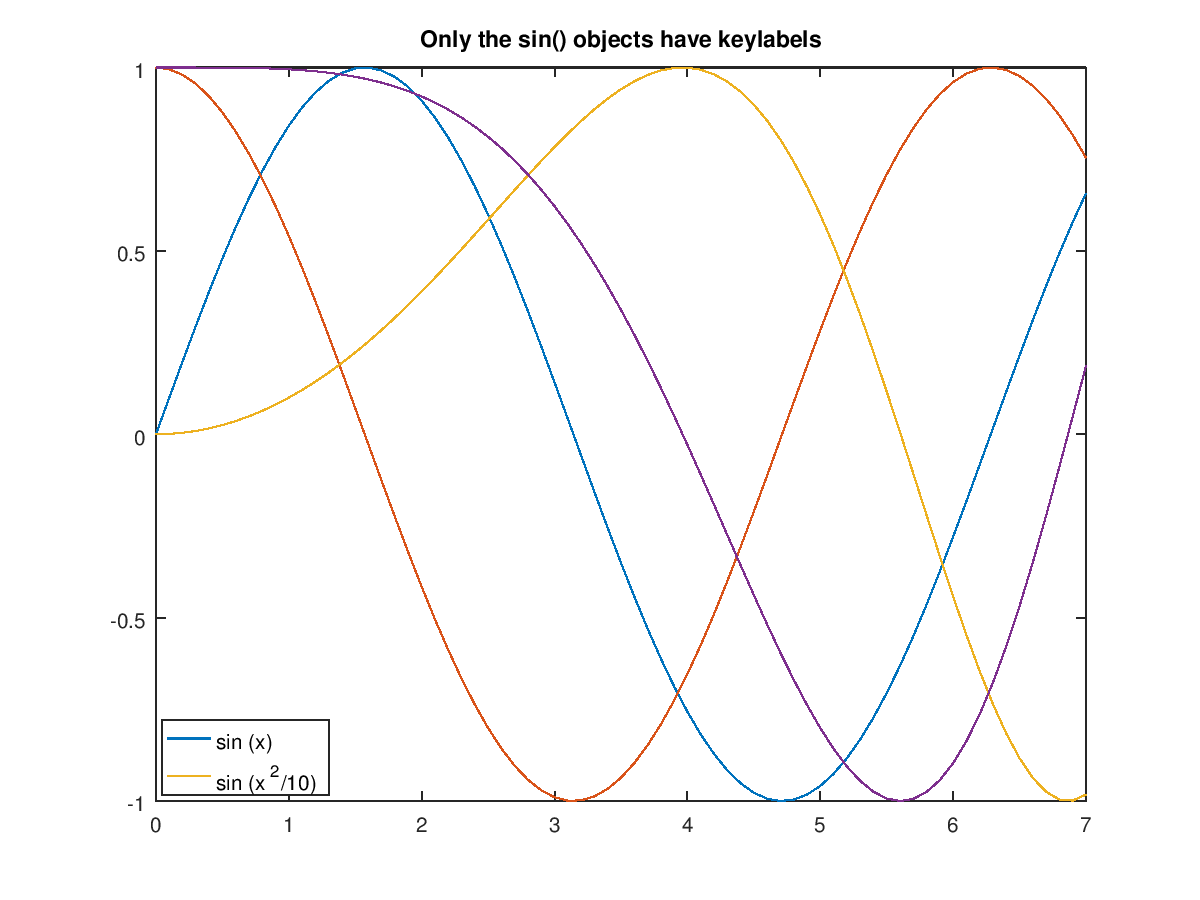
The following code
 clf;
 x = 0:0.1:7;
 h = plot (x,sin(x), x,cos(x), x,sin(x.^2/10), x,cos(x.^2/10));
 title ("Only the sin() objects have keylabels");
 legend (h([1, 3]), {"sin (x)", "sin (x^2/10)"}, "location", "southwest");
Produces the following figure
| Figure 1 |
|---|
 |
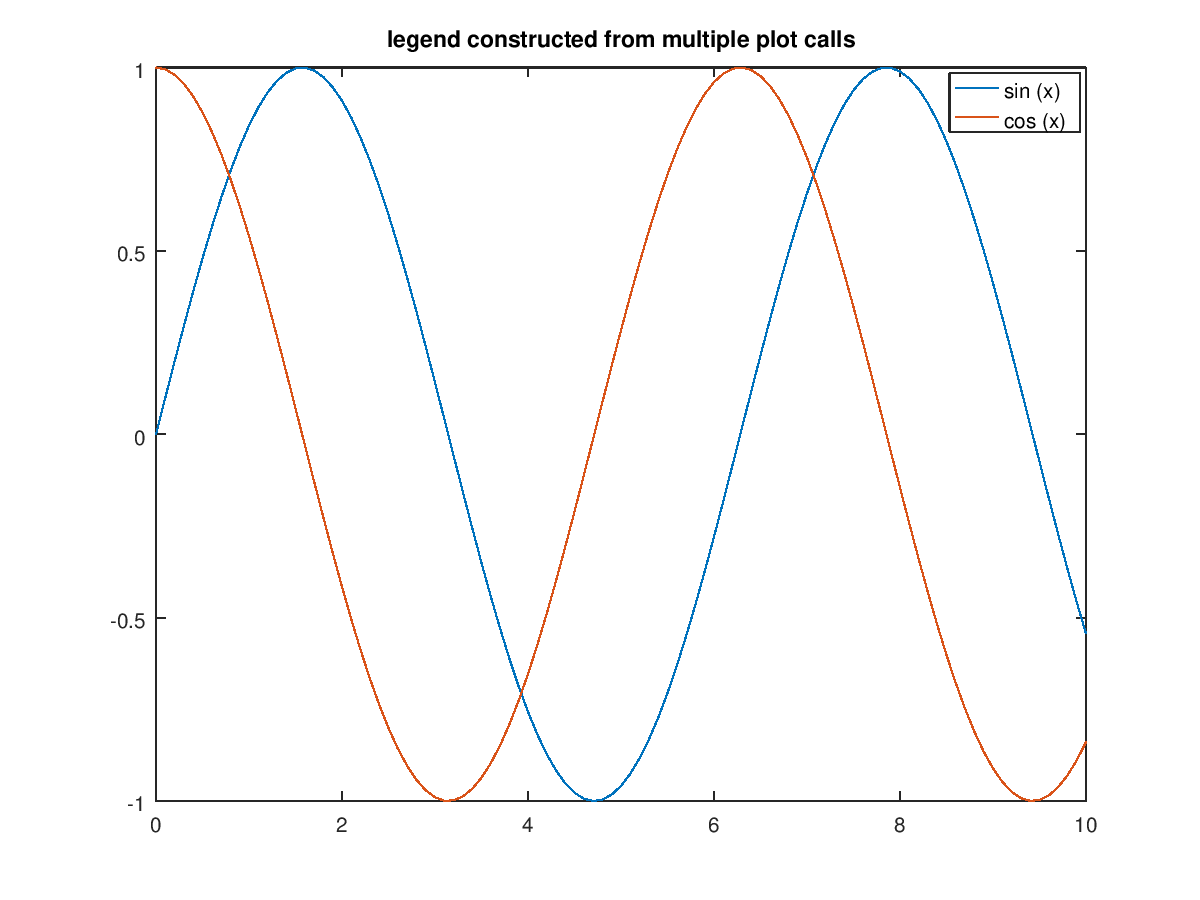
The following code
 clf;
 x = 0:0.1:10;
 plot (x, sin (x), ";sin (x);");
 hold on;
 plot (x, cos (x), ";cos (x);");
 hold off;
 title ("legend constructed from multiple plot calls");
Produces the following figure
| Figure 1 |
|---|
 |
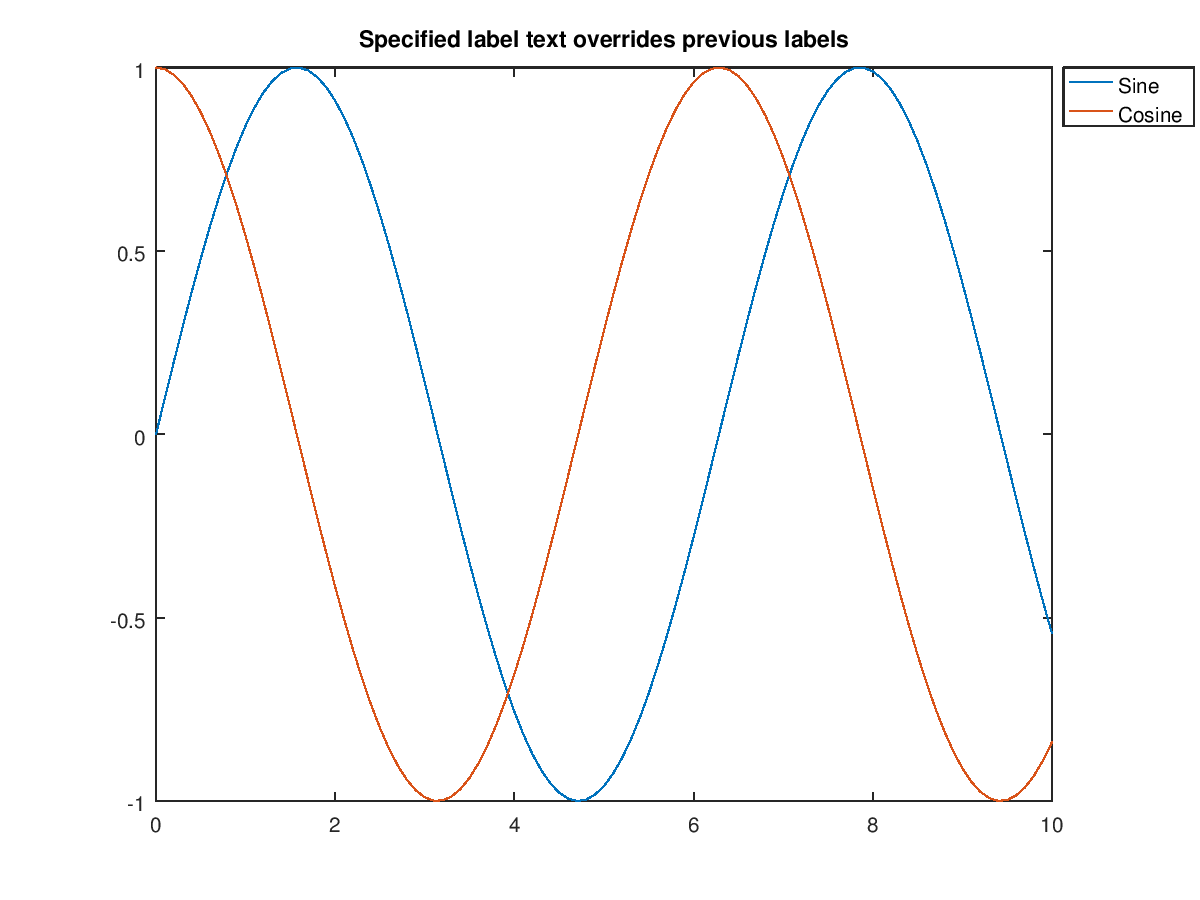
The following code
 clf;
 x = 0:0.1:10;
 plot (x, sin (x), ";sin (x);");
 hold on;
 plot (x, cos (x), ";cos (x);");
 hold off;
 title ("Specified label text overrides previous labels");
 legend ({"Sine", "Cosine"}, "location", "northeastoutside");
Produces the following figure
| Figure 1 |
|---|
 |
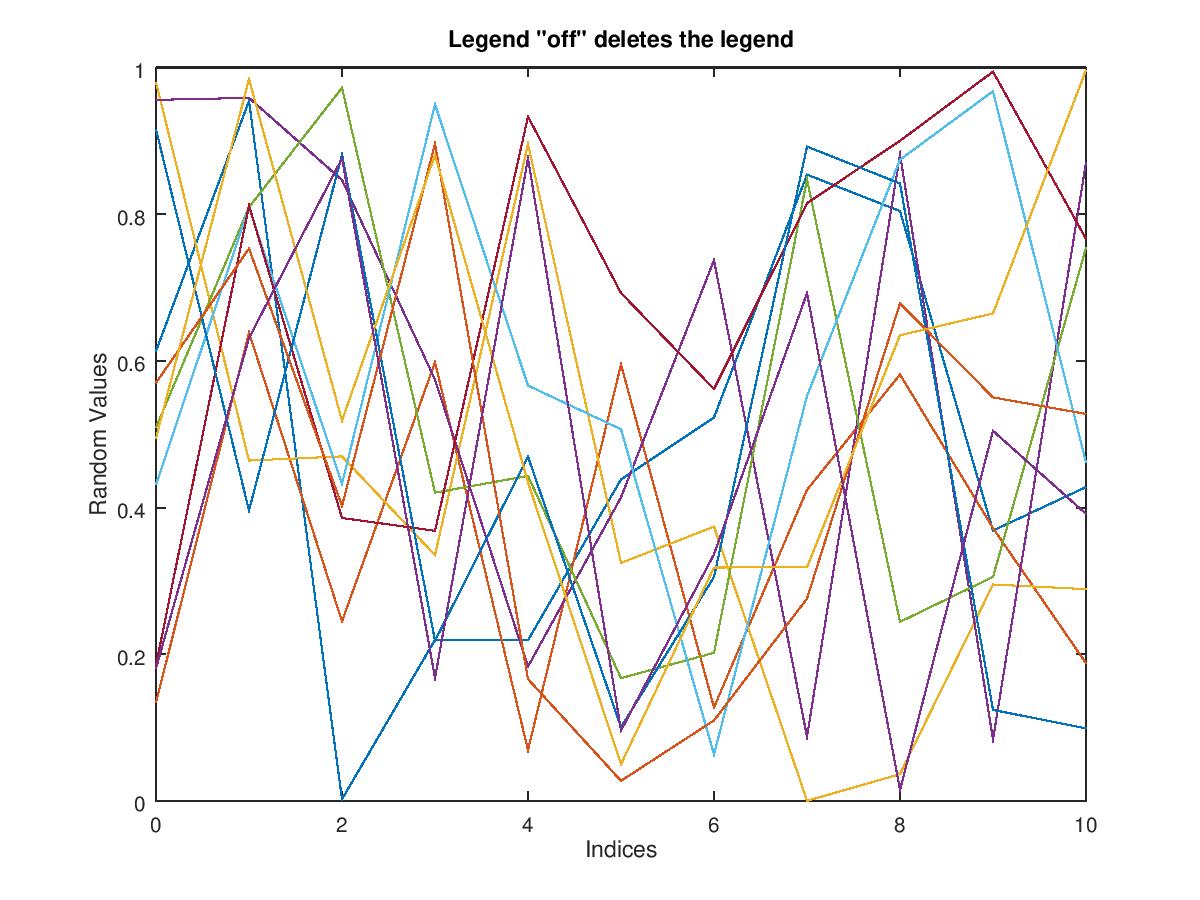
The following code
 clf;
 x = 0:10;
 plot (x, rand (11));
 xlabel ("Indices");
 ylabel ("Random Values");
 title ('Legend "off" deletes the legend');
 legend (cellstr (num2str ((0:10)')), "location", "northeastoutside");
 pause (1);
 legend off;
 axis ([0, 10, 0 1]);
Produces the following figure
| Figure 1 |
|---|
 |
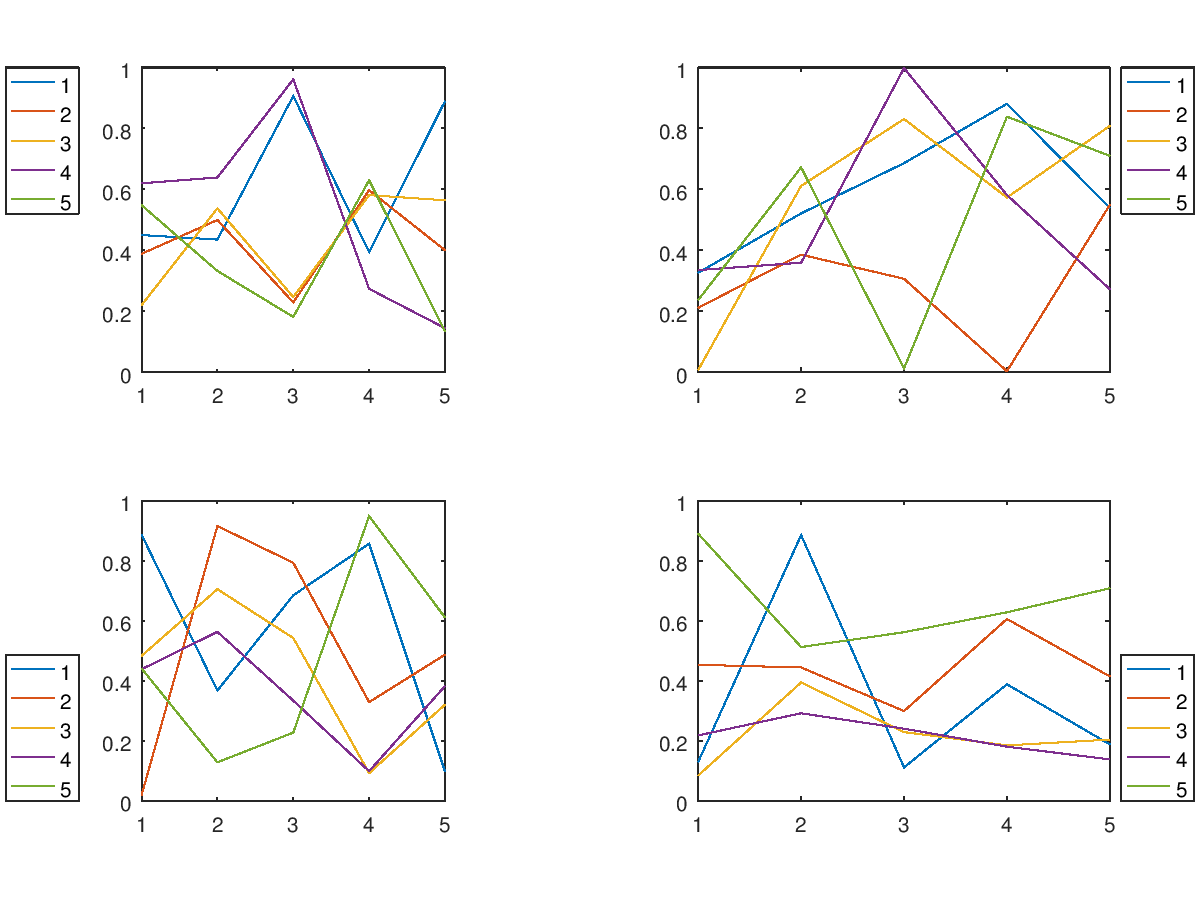
The following code
 clf;
 x = (1:5)';
 subplot (2,2,1);
  plot (x, rand (numel (x)));
  legend (cellstr (num2str (x)), "location", "northwestoutside");
 subplot (2,2,2);
  plot (x, rand (numel (x)));
  legend (cellstr (num2str (x)), "location", "northeastoutside");
 subplot (2,2,3);
  plot (x, rand (numel (x)));
  legend (cellstr (num2str (x)), "location", "southwestoutside");
 subplot (2,2,4);
  plot (x, rand (numel (x)));
  legend (cellstr (num2str (x)), "location", "southeastoutside");
 ## Legend works on a per axes basis for each subplot
Produces the following figure
| Figure 1 |
|---|
 |
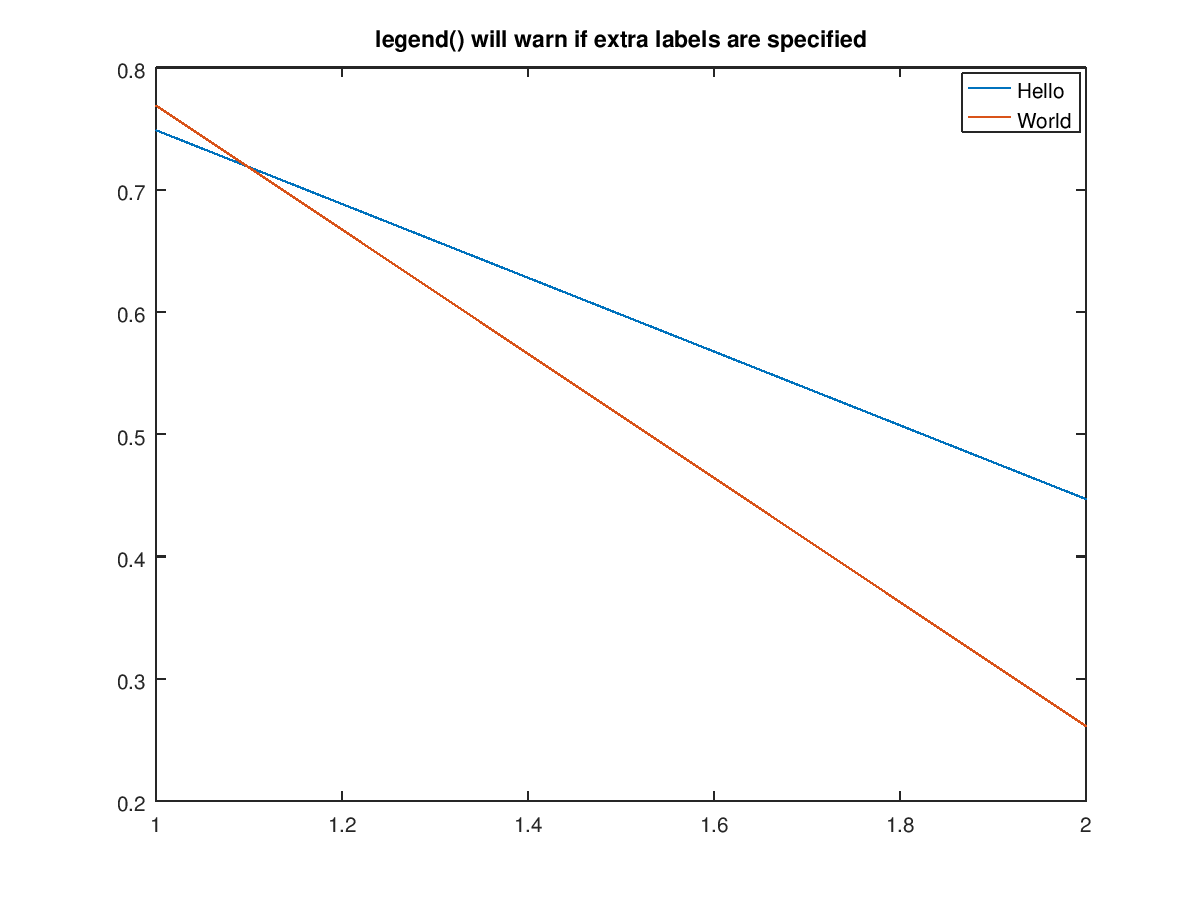
The following code
 clf;
 plot (rand (2));
 title ("legend() will warn if extra labels are specified");
 legend ("Hello", "World", "interpreter", "foobar");
Produces the following output
warning: legend: ignoring extra labels
and the following figure
| Figure 1 |
|---|
 |
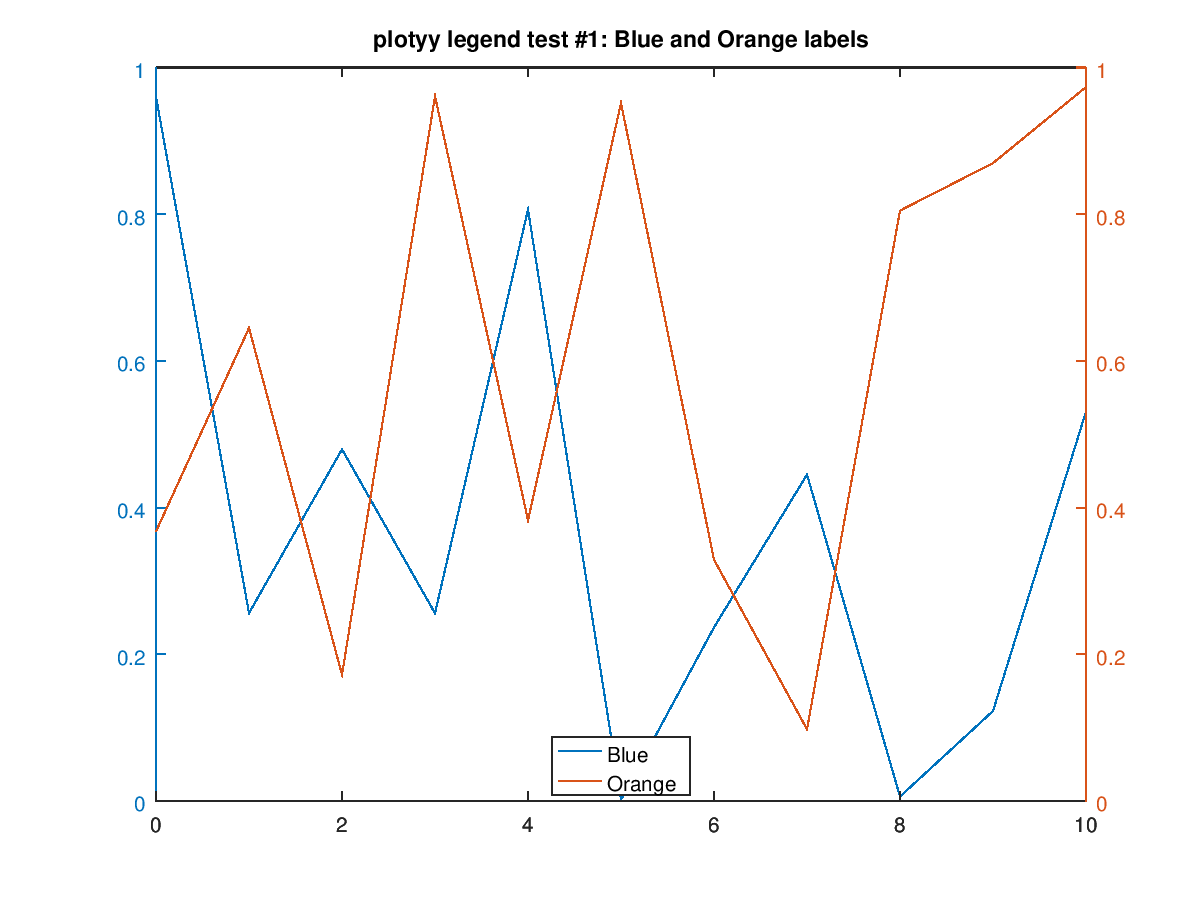
The following code
 clf;
 x = 0:10;
 y1 = rand (size (x));
 y2 = rand (size (x));
 [ax, h1, h2] = plotyy (x, y1, x, y2);
 title ("plotyy legend test #1: Blue and Orange labels");
 legend ([h1, h2], {"Blue", "Orange"}, "location", "south");
Produces the following figure
warning: legend: ignoring extra labels
and the following figure
| Figure 1 |
|---|
 |
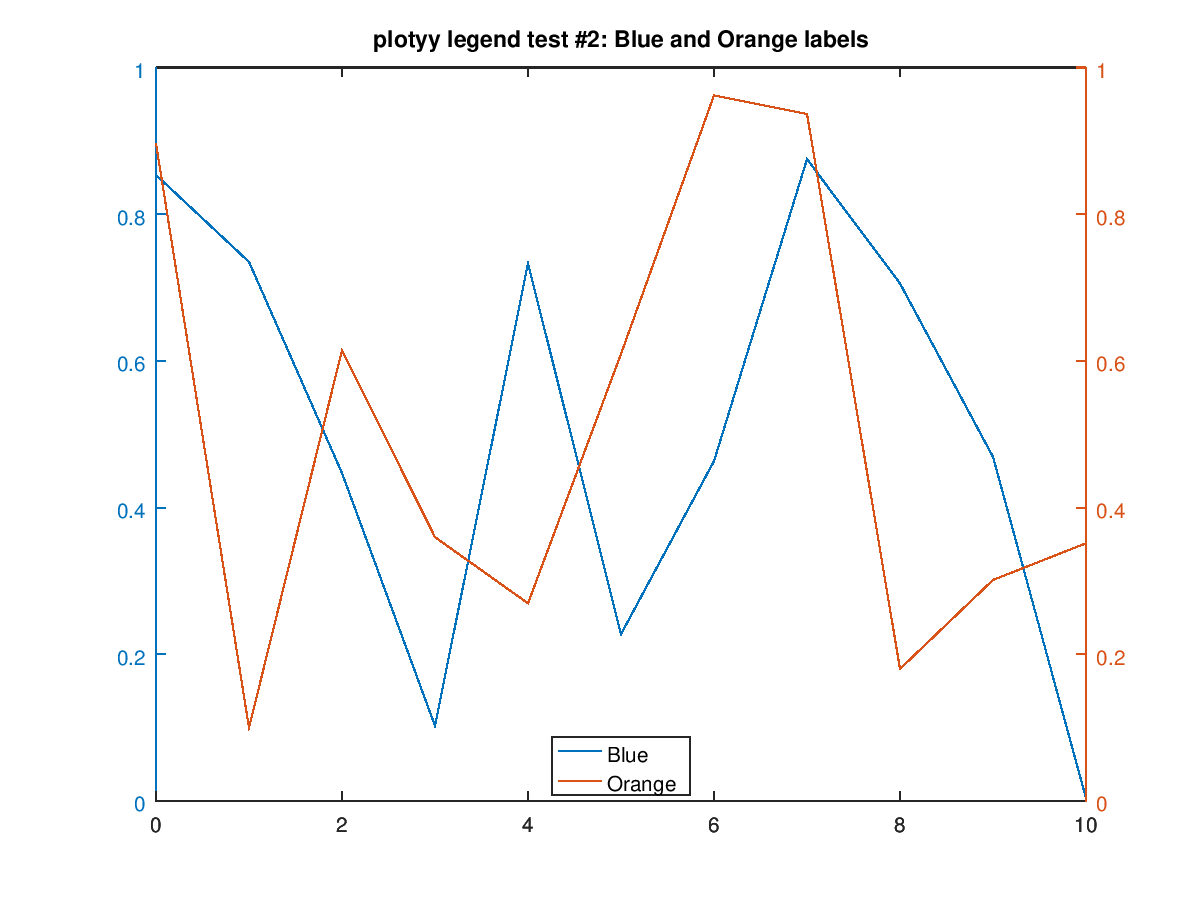
The following code
 clf;
 x = 0:10;
 y1 = rand (size (x));
 y2 = rand (size (x));
 [ax, h1, h2] = plotyy (x, y1, x, y2);
 title ("plotyy legend test #2: Blue and Orange labels");
 legend ({"Blue", "Orange"}, "location", "south");
Produces the following figure
warning: legend: ignoring extra labels
and the following figure
| Figure 1 |
|---|
 |
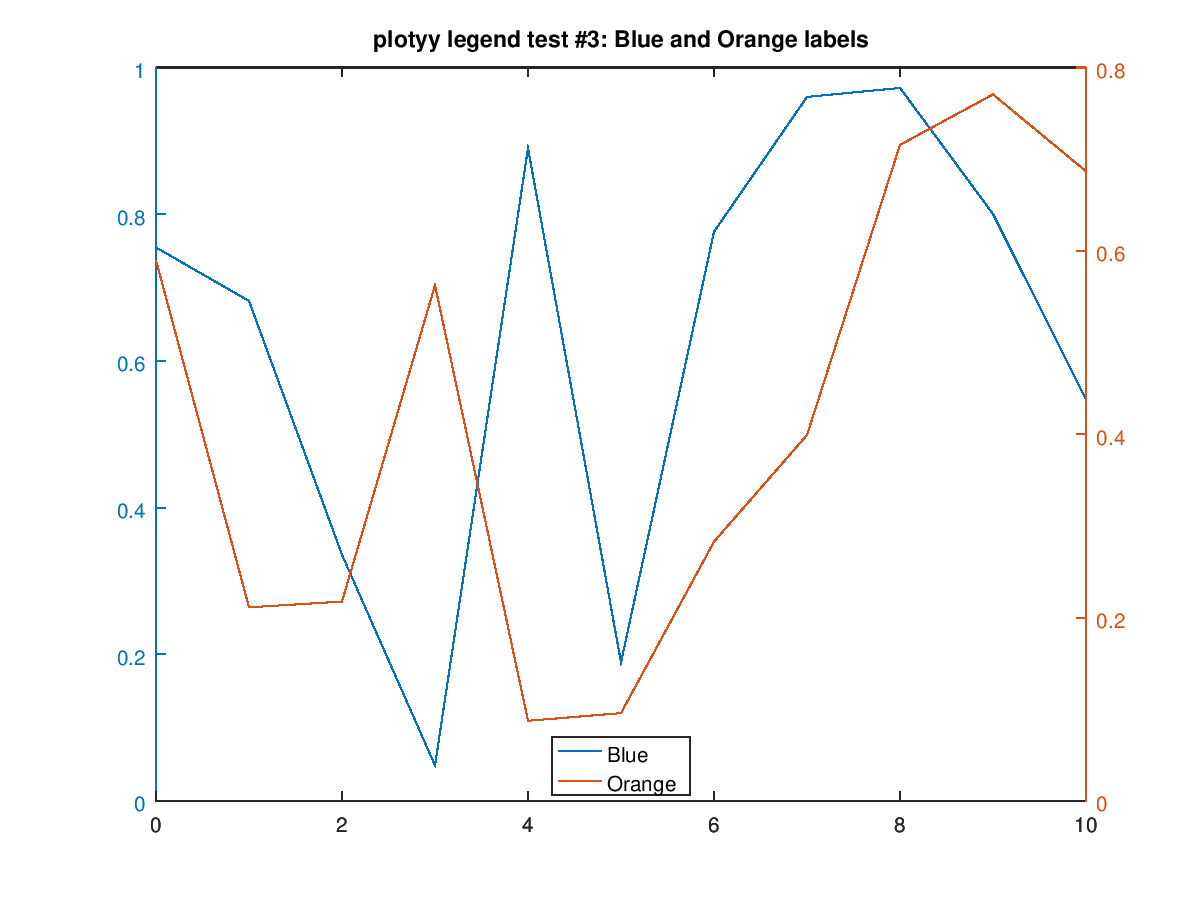
The following code
 clf;
 x = 0:10;
 y1 = rand (size (x));
 y2 = rand (size (x));
 [ax, h1, h2] = plotyy (x, y1, x, y2);
 title ("plotyy legend test #3: Blue and Orange labels");
 legend ("Blue", "Orange", "location", "south");
Produces the following figure
warning: legend: ignoring extra labels
and the following figure
| Figure 1 |
|---|
 |
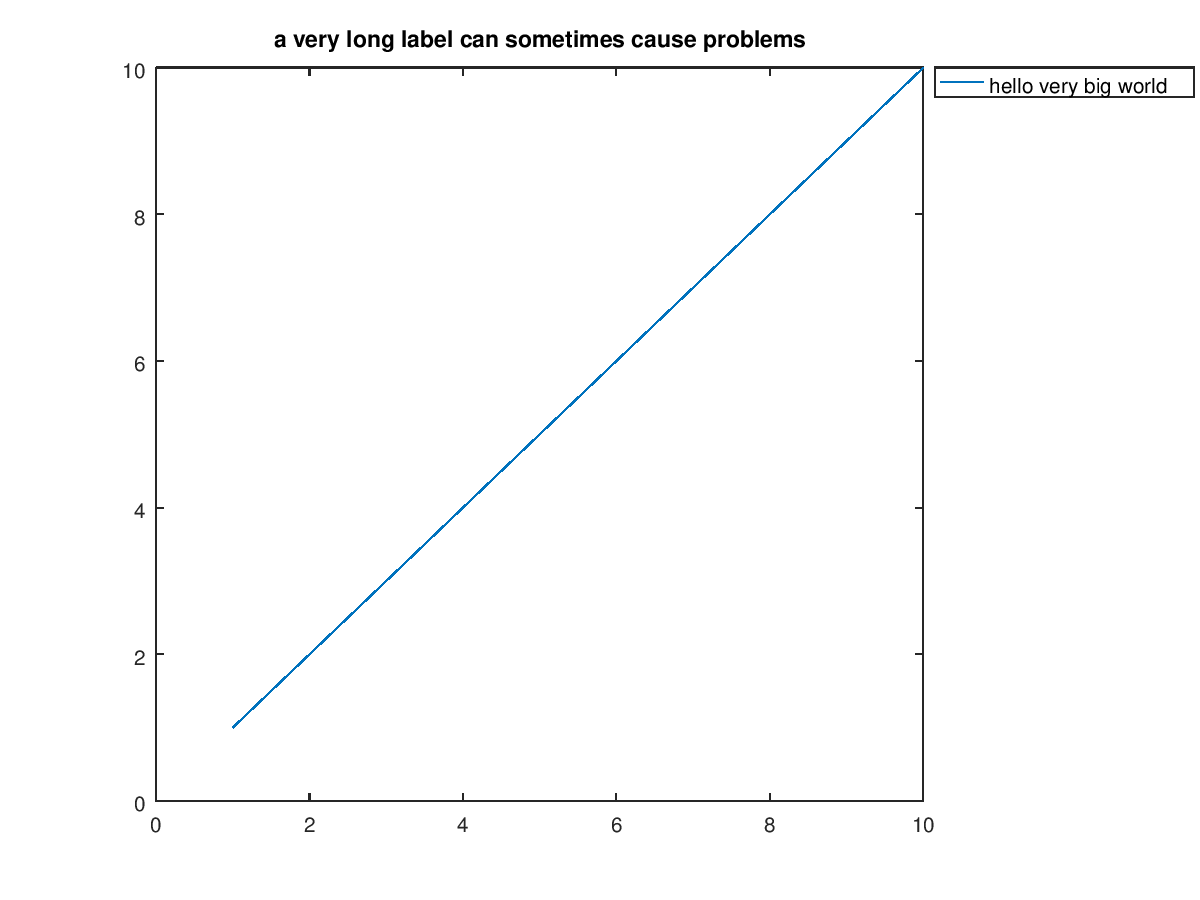
The following code
 clf;
 plot (1:10, 1:10);
 title ("a very long label can sometimes cause problems");
 legend ("hello very big world", "location", "northeastoutside");
Produces the following figure
warning: legend: ignoring extra labels
and the following figure
| Figure 1 |
|---|
 |
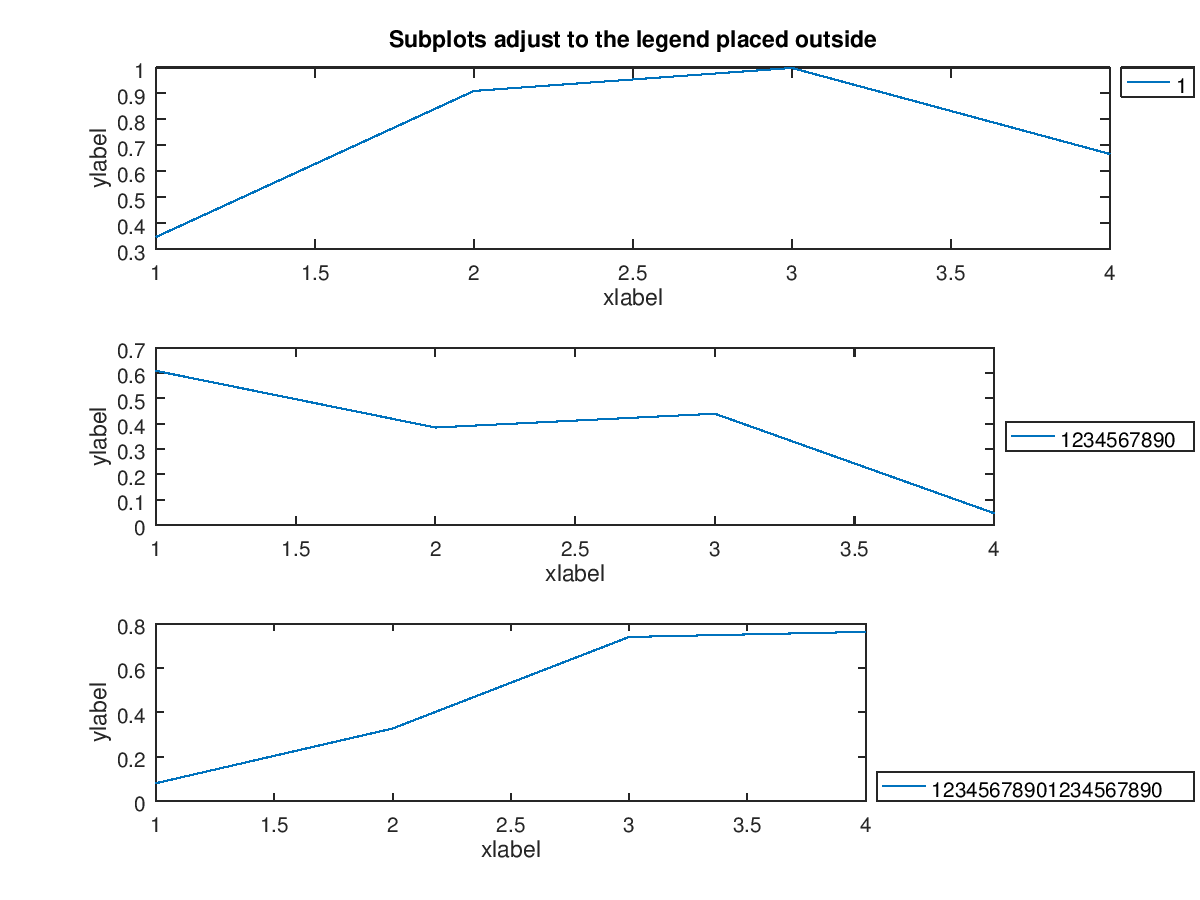
The following code
  # bug 36408
 clf;
 option = "right";
 subplot (3,1,1);
  plot (rand (1,4));
  xlabel xlabel;
  ylabel ylabel;
  title ("Subplots adjust to the legend placed outside");
  legend ({"1"}, "location", "northeastoutside");
  legend (option);
 subplot (3,1,2);
  plot (rand (1,4));
  xlabel xlabel;
  ylabel ylabel;
  legend ({"1234567890"}, "location", "eastoutside");
  legend (option);
 subplot (3,1,3);
  plot (rand (1,4));
  xlabel xlabel;
  ylabel ylabel;
  legend ({"12345678901234567890"}, "location", "southeastoutside");
  legend (option);
Produces the following figure
warning: legend: ignoring extra labels
and the following figure
| Figure 1 |
|---|
 |
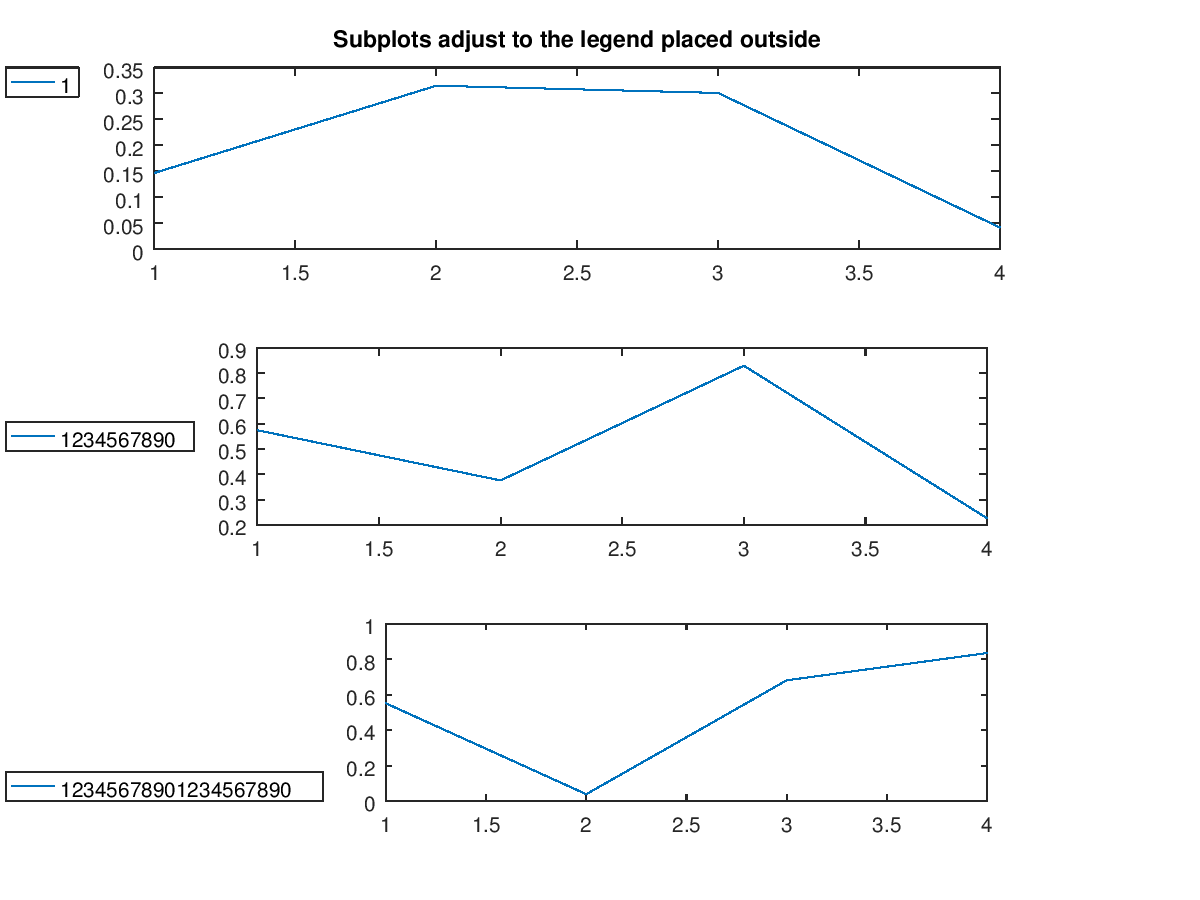
The following code
  # bug 36408
 clf;
 option = "right";
 subplot (3,1,1);
  plot (rand (1,4));
  title ("Subplots adjust to the legend placed outside");
  legend ({"1"}, "location", "northwestoutside");
  legend (option);
 subplot (3,1,2);
  plot (rand (1,4));
  legend ({"1234567890"}, "location", "westoutside");
  legend (option);
 subplot (3,1,3);
  plot (rand (1,4));
  legend ({"12345678901234567890"}, "location", "southwestoutside");
  legend (option);
Produces the following figure
warning: legend: ignoring extra labels
and the following figure
| Figure 1 |
|---|
 |
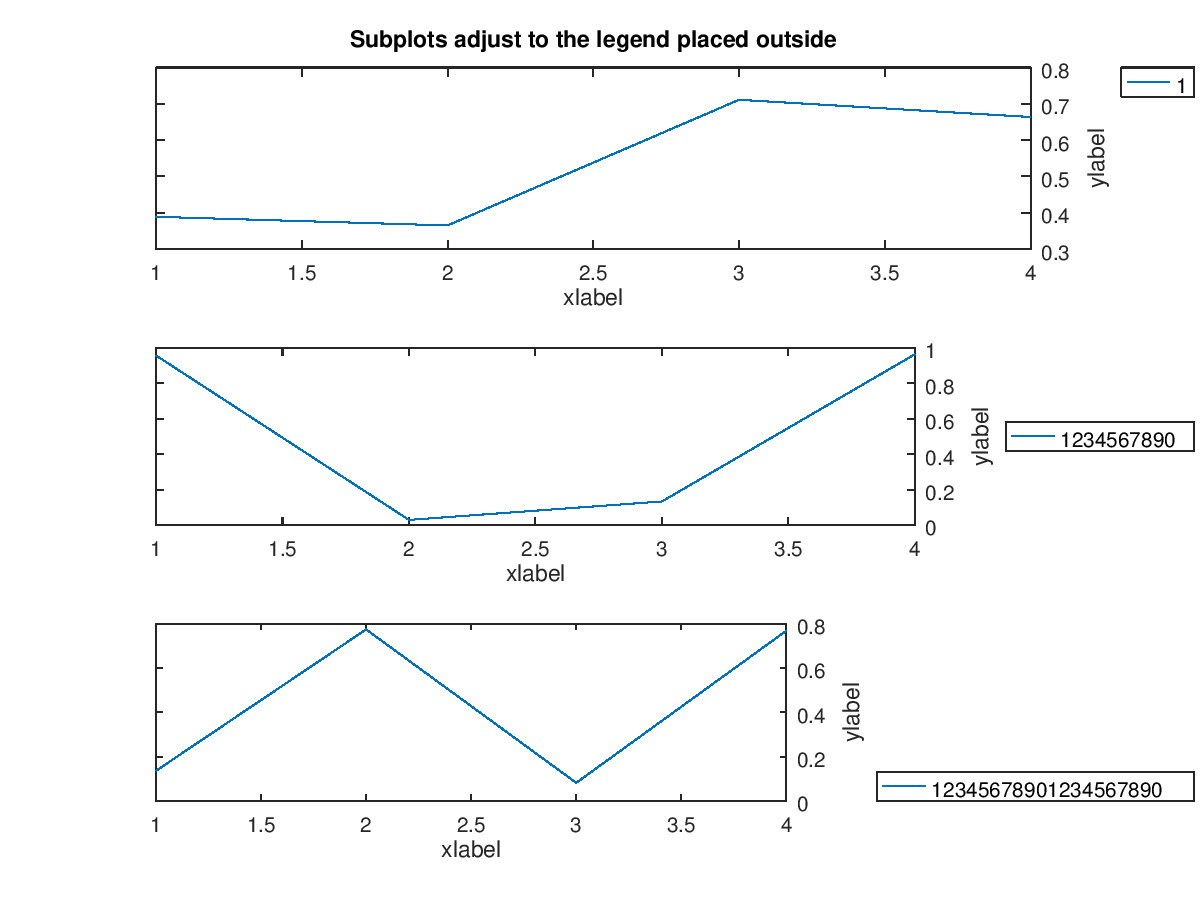
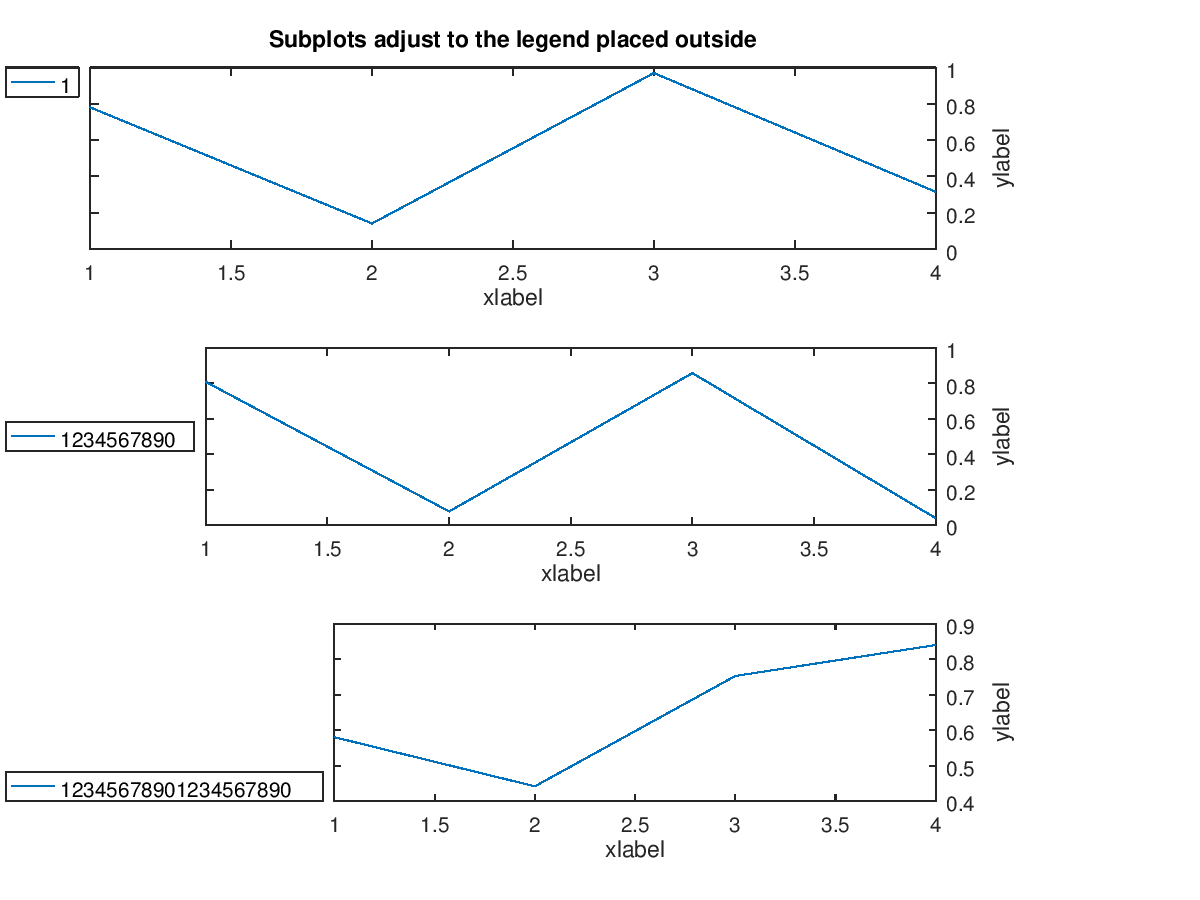
The following code
  # bug 36408
 clf;
 option = "right";
 subplot (3,1,1);
  plot (rand (1,4));
  set (gca (), "yaxislocation", "right");
  xlabel ("xlabel");
  ylabel ("ylabel");
  title ("Subplots adjust to the legend placed outside");
  legend ({"1"}, "location", "northeastoutside");
  legend (option);
 subplot (3,1,2);
  plot (rand (1,4));
  set (gca (), "yaxislocation", "right");
  xlabel ("xlabel");
  ylabel ("ylabel");
  legend ({"1234567890"}, "location", "eastoutside");
  legend (option);
 subplot (3,1,3);
  plot (rand (1,4));
  set (gca (), "yaxislocation", "right");
  xlabel ("xlabel");
  ylabel ("ylabel");
  legend ({"12345678901234567890"}, "location", "southeastoutside");
  legend (option);
Produces the following figure
warning: legend: ignoring extra labels
and the following figure
| Figure 1 |
|---|
 |
The following code
  # bug 36408
 clf;
 option = "right";
 subplot (3,1,1);
  plot (rand (1,4));
  set (gca (), "yaxislocation", "right");
  xlabel ("xlabel");
  ylabel ("ylabel");
  title ("Subplots adjust to the legend placed outside");
  legend ({"1"}, "location", "northwestoutside");
  legend (option);
 subplot (3,1,2);
  plot (rand (1,4));
  set (gca (), "yaxislocation", "right");
  xlabel ("xlabel");
  ylabel ("ylabel");
  legend ({"1234567890"}, "location", "westoutside");
  legend (option);
 subplot (3,1,3);
  plot (rand (1,4));
  set (gca (), "yaxislocation", "right");
  xlabel ("xlabel");
  ylabel ("ylabel");
  legend ({"12345678901234567890"}, "location", "southwestoutside");
  legend (option);
Produces the following figure
warning: legend: ignoring extra labels
and the following figure
| Figure 1 |
|---|
 |
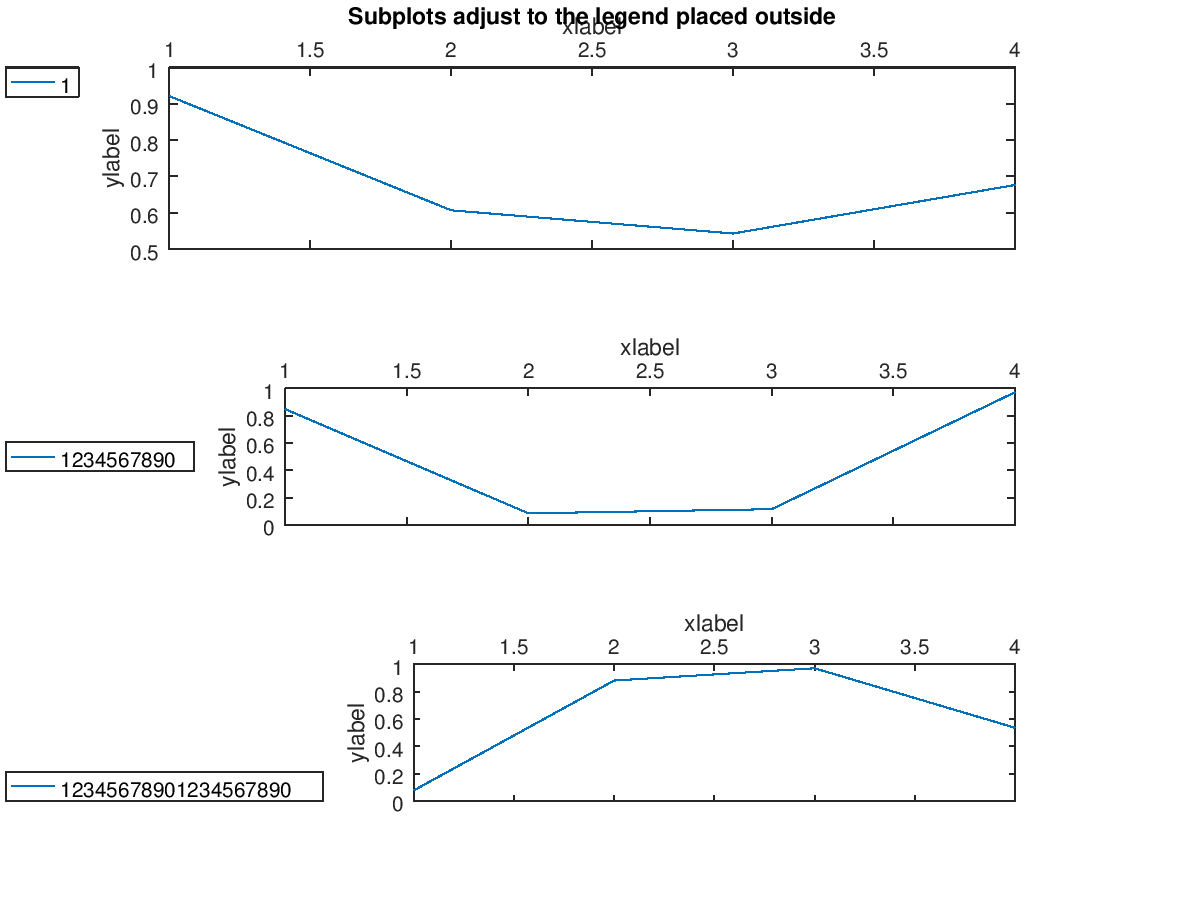
The following code
  # bug 36408;
 clf;
 option = "right";
 subplot (3,1,1);
  plot (rand (1,4));
  set (gca (), "xaxislocation", "top");
  xlabel ("xlabel");
  ylabel ("ylabel");
  title ("Subplots adjust to the legend placed outside");
  legend ({"1"}, "location", "northwestoutside");
  legend (option);
 subplot (3,1,2);
  plot (rand (1,4));
  set (gca (), "xaxislocation", "top");
  xlabel ("xlabel");
  ylabel ("ylabel");
  legend ({"1234567890"}, "location", "westoutside");
  legend (option);
 subplot (3,1,3);
  plot (rand (1,4));
  set (gca (), "xaxislocation", "top");
  xlabel ("xlabel");
  ylabel ("ylabel");
  legend ({"12345678901234567890"}, "location", "southwestoutside");
  legend (option);
Produces the following figure
warning: legend: ignoring extra labels
and the following figure
| Figure 1 |
|---|
 |
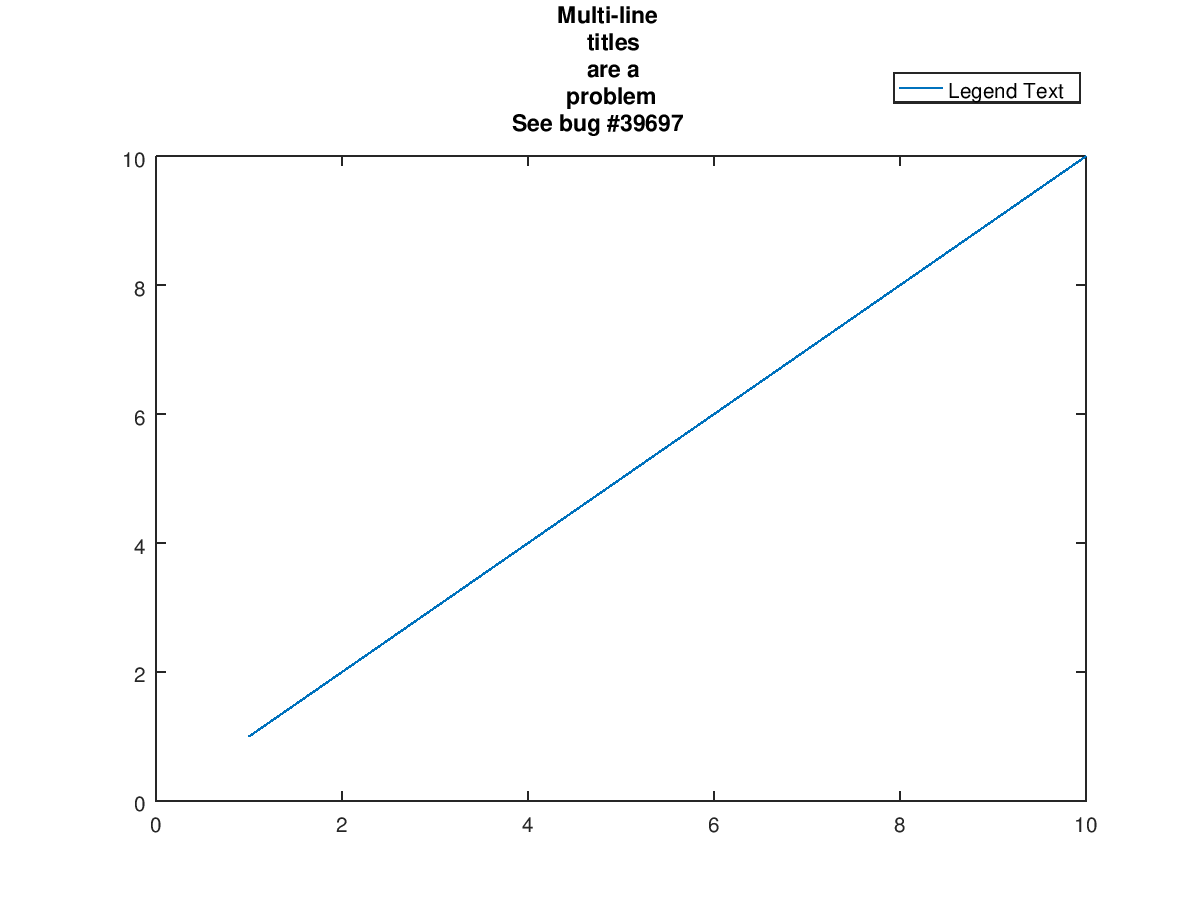
The following code
  # bug 39697
 clf;
 plot (1:10);
 legend ("Legend Text");
 title ({"Multi-line", "titles", "are a", "problem", "See bug #39697"});
Produces the following figure
warning: legend: ignoring extra labels
and the following figure
| Figure 1 |
|---|
 |
Package: octave