
|
Octave-Forge - Extra packages for GNU Octave |
| Home · Packages · Developers · Documentation · FAQ · Bugs · Mailing Lists · Links · Code |
|
|
Octave-Forge - Extra packages for GNU Octave |
| Home · Packages · Developers · Documentation · FAQ · Bugs · Mailing Lists · Links · Code |
Create line object from x and y (and possibly z) and insert in the current axes.
Multiple property-value pairs may be specified for the line object, but they must appear in pairs.
If the first argument hax is an axes handle, then plot into this axis,
rather than the current axes returned by gca.
The optional return value h is a graphics handle (or vector of handles) to the line objects created.
See also: image, patch, rectangle, surface, text.
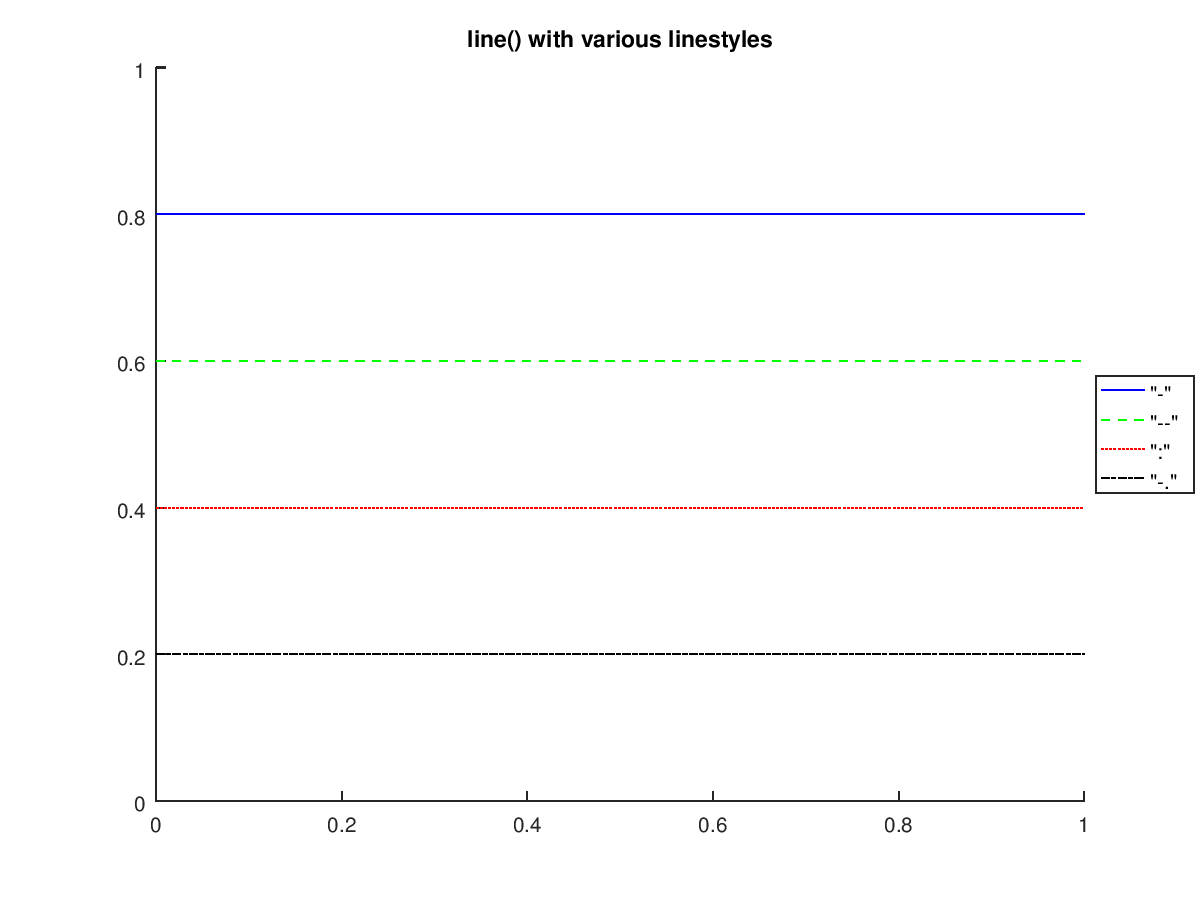
The following code
 clf;
 line ([0 1], [0.8 0.8], "linestyle", "-", "color", "b");
 line ([0 1], [0.6 0.6], "linestyle", "--", "color", "g");
 line ([0 1], [0.4 0.4], "linestyle", ":", "color", "r");
 line ([0 1], [0.2 0.2], "linestyle", "-.", "color", "k");
 ylim ([0 1]);
 title ("line() with various linestyles");
 legend ('"-"', '"--"', '":"', '"-."', 'location', 'eastoutside');
Produces the following figure
| Figure 1 |
|---|
 |
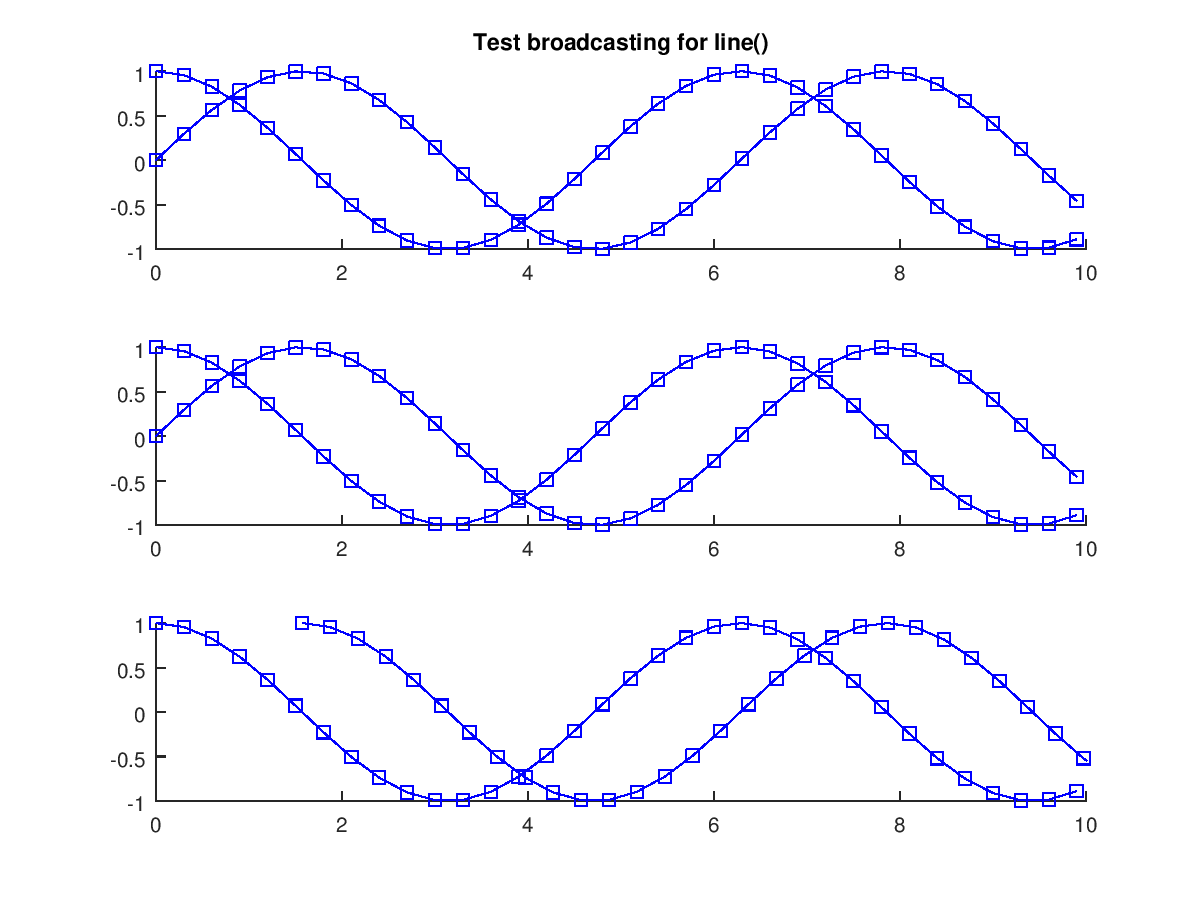
The following code
 clf;
 x = 0:0.3:10;
 y1 = cos (x);
 y2 = sin (x);
 subplot (3,1,1);
  args = {"color", "b", "marker", "s"};
  line ([x(:), x(:)], [y1(:), y2(:)], args{:});
  title ("Test broadcasting for line()");
 subplot (3,1,2);
  line (x(:), [y1(:), y2(:)], args{:});
 subplot (3,1,3);
  line ([x(:), x(:)+pi/2], y1(:), args{:});
  xlim ([0 10]);
Produces the following figure
| Figure 1 |
|---|
 |
Package: octave