
|
Octave-Forge - Extra packages for GNU Octave |
| Home · Packages · Developers · Documentation · FAQ · Bugs · Mailing Lists · Links · Code |
|
|
Octave-Forge - Extra packages for GNU Octave |
| Home · Packages · Developers · Documentation · FAQ · Bugs · Mailing Lists · Links · Code |
Produce 2-D plots on a double logarithm axis with errorbars.
Many different combinations of arguments are possible. The most common form is
loglogerr (x, y, ey, fmt)
which produces a double logarithm plot of y versus x with errors in the y-scale defined by ey and the plot format defined by fmt. See ‘errorbar’, for available formats and additional information.
If the first argument hax is an axes handle, then plot into this axis,
rather than the current axes returned by gca.
See also: errorbar, semilogxerr, semilogyerr.
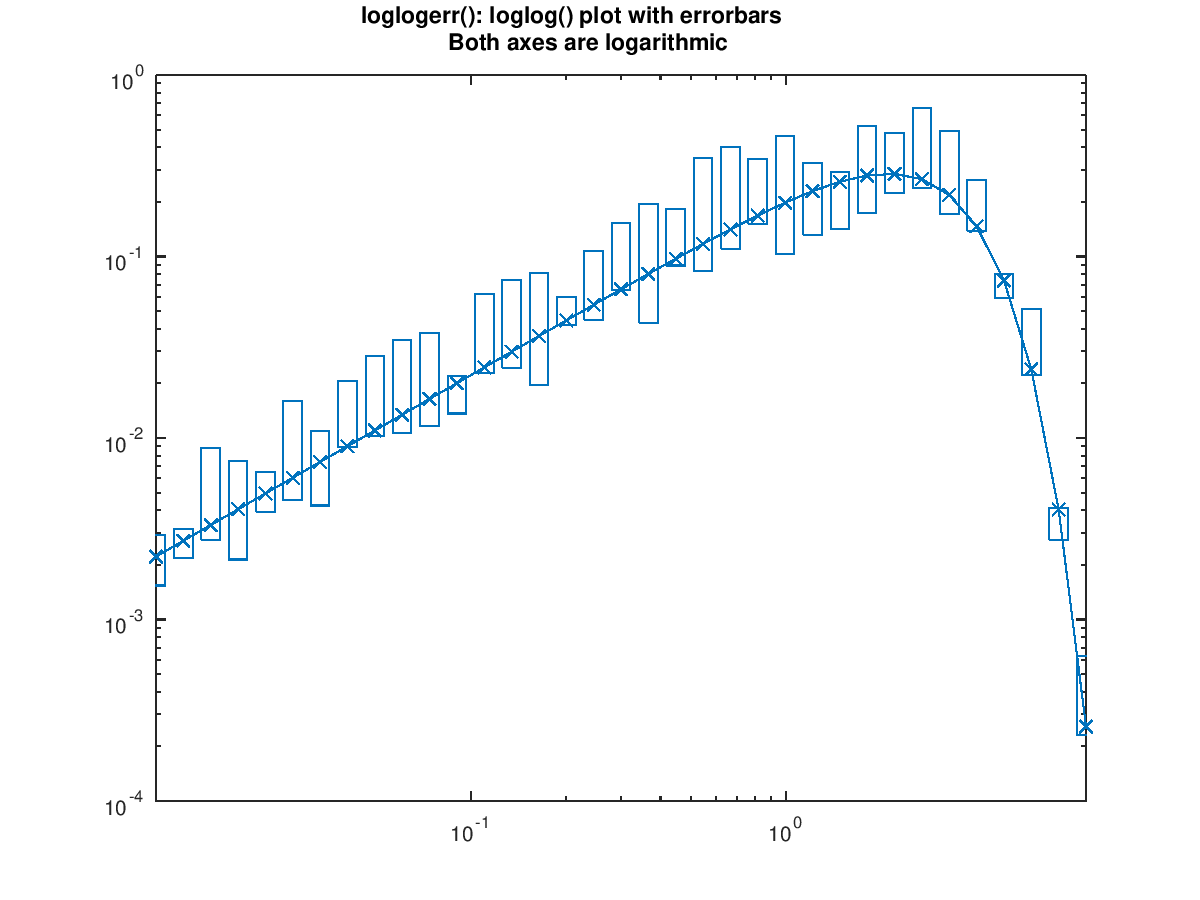
The following code
 clf;
 x = exp (log (0.01):0.2:log (10));
 y = wblpdf (x, 3, 2);
 eyu = 2*rand (size (y)) .* y;
 eyl = 0.5*rand (size (y)) .* y;
 loglogerr (x, y, eyl, eyu, "#~x-");
 xlim (x([1, end]));
 title ({"loglogerr(): loglog() plot with errorbars", ...
         "Both axes are logarithmic"});
Produces the following figure
| Figure 1 |
|---|
 |
Package: octave