
|
Octave-Forge - Extra packages for GNU Octave |
| Home · Packages · Developers · Documentation · FAQ · Bugs · Mailing Lists · Links · Code |
|
|
Octave-Forge - Extra packages for GNU Octave |
| Home · Packages · Developers · Documentation · FAQ · Bugs · Mailing Lists · Links · Code |
Draw a Pareto chart.
A Pareto chart is a bar graph that arranges information in such a way that priorities for process improvement can be established; It organizes and displays information to show the relative importance of data. The chart is similar to the histogram or bar chart, except that the bars are arranged in decreasing magnitude from left to right along the x-axis.
The fundamental idea (Pareto principle) behind the use of Pareto diagrams is that the majority of an effect is due to a small subset of the causes. For quality improvement, the first few contributing causes (leftmost bars as presented on the diagram) to a problem usually account for the majority of the result. Thus, targeting these "major causes" for elimination results in the most cost-effective improvement scheme.
Typically only the magnitude data y is present in which case
x is taken to be the range 1 : length (y). If x
is given it may be a string array, a cell array of strings, or a numerical
vector.
If the first argument hax is an axes handle, then plot into this axis,
rather than the current axes returned by gca.
The optional return value h is a 2-element vector with a graphics handle for the created bar plot and a second handle for the created line plot.
An example of the use of pareto is
Cheese = {"Cheddar", "Swiss", "Camembert", ...
          "Munster", "Stilton", "Blue"};
Sold = [105, 30, 70, 10, 15, 20];
pareto (Sold, Cheese);
See also: bar, barh, hist, pie, plot.
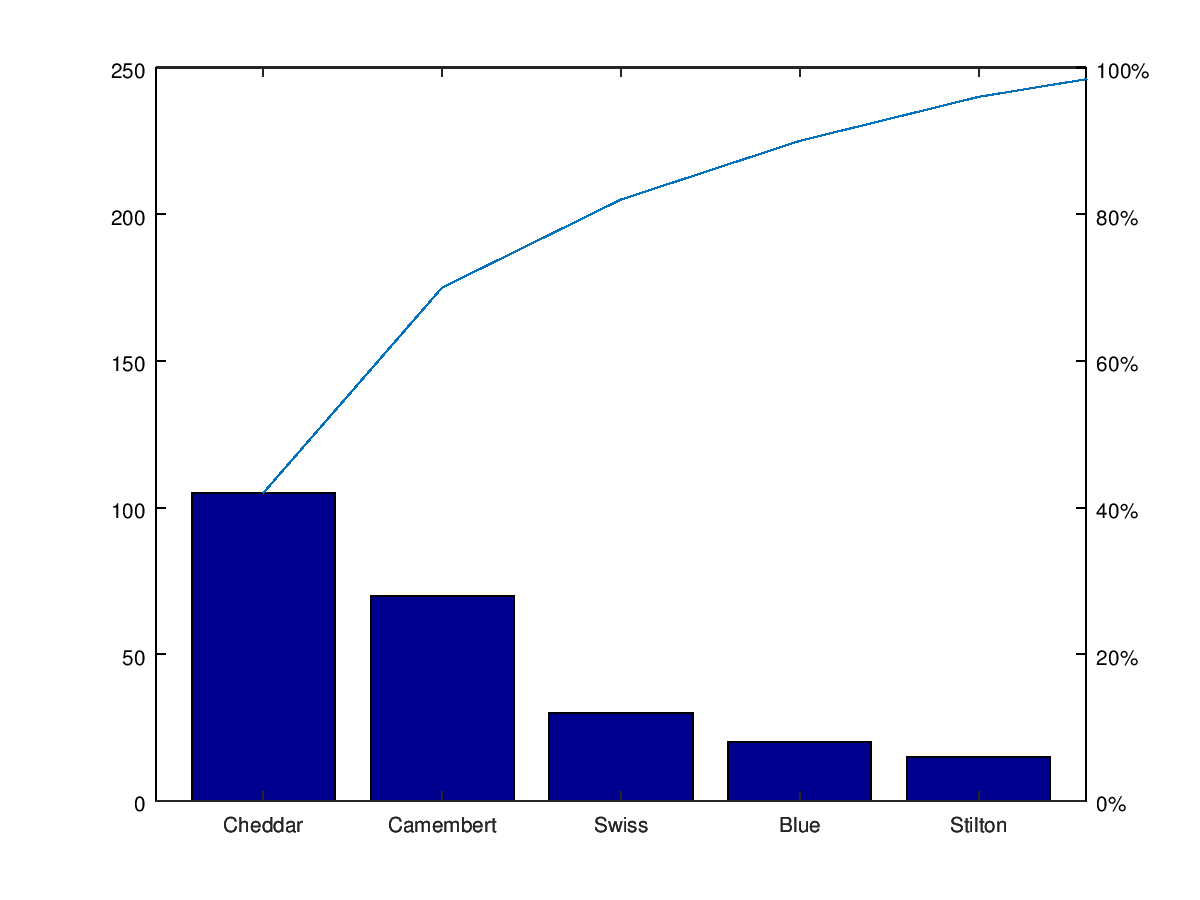
The following code
 clf;
 colormap (jet (64));
 Cheese = {"Cheddar", "Swiss", "Camembert", "Munster", "Stilton", "Blue"};
 Sold = [105, 30, 70, 10, 15, 20];
 pareto (Sold, Cheese);
Produces the following figure
| Figure 1 |
|---|
 |
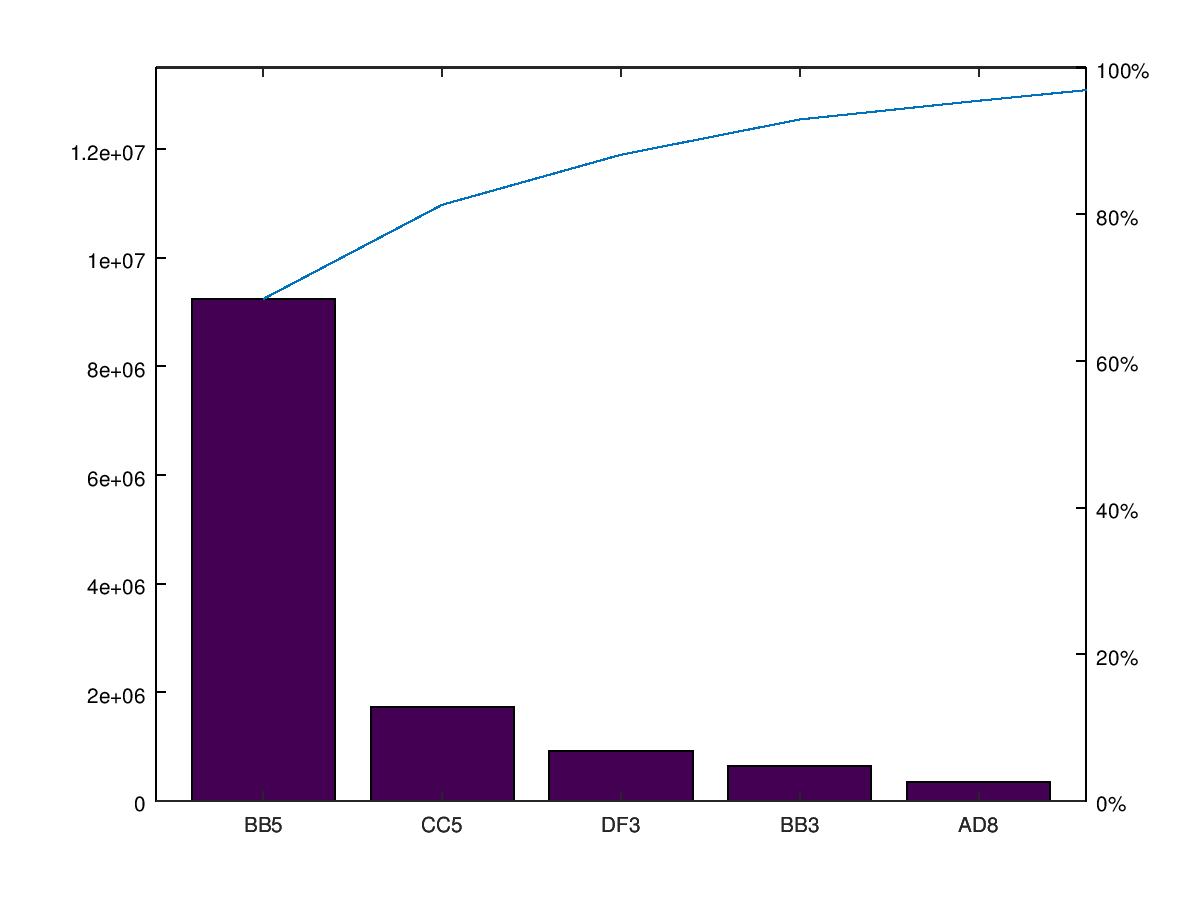
The following code
 clf;
 ## Suppose that we want establish which products makes 80% of turnover.
 Codes = {"AB4","BD7","CF8","CC5","AD11","BB5","BB3","AD8","DF3","DE7"};
 Value = [2.35 7.9 2.45 1.1 0.15 13.45 5.4 2.05 0.85 1.65]';
 SoldUnits = [54723 41114 16939 1576091 168000 687197 120222 168195, ...
              1084118 55576]';
 pareto (Value.*SoldUnits, Codes);
Produces the following figure
| Figure 1 |
|---|
 |
Package: octave