
|
Octave-Forge - Extra packages for GNU Octave |
| Home · Packages · Developers · Documentation · FAQ · Bugs · Mailing Lists · Links · Code |
|
|
Octave-Forge - Extra packages for GNU Octave |
| Home · Packages · Developers · Documentation · FAQ · Bugs · Mailing Lists · Links · Code |
Plot a 2-D pie chart.
When called with a single vector argument, produce a pie chart of the
elements in x. The size of the ith slice is the percentage that the
element xi represents of the total sum of x:
pct = x(i) / sum (x).
The optional input explode is a vector of the same length as x that, if nonzero, "explodes" the slice from the pie chart.
The optional input labels is a cell array of strings of the same length as x specifying the label for each slice.
If the first argument hax is an axes handle, then plot into this axis,
rather than the current axes returned by gca.
The optional return value h is a list of handles to the patch and text objects generating the plot.
Note: If sum (x) ≤ 1 then the elements of x are
interpreted as percentages directly and are not normalized by sum
(x). Furthermore, if the sum is less than 1 then there will be a missing
slice in the pie plot to represent the missing, unspecified percentage.
See also: pie3, bar, hist, rose.
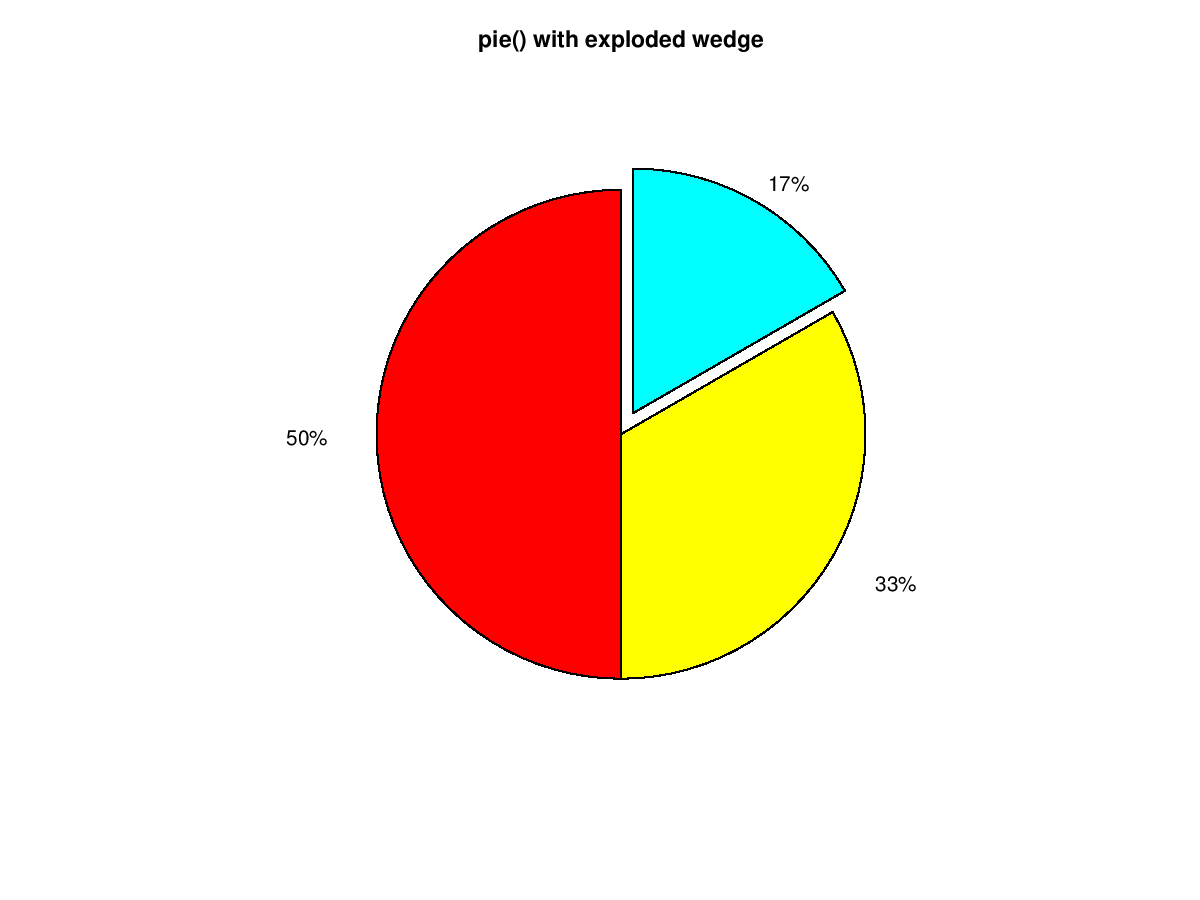
The following code
 clf;
 pie ([3, 2, 1], [0, 0, 1]);
 colormap ([1,0,0;0,1,0;0,0,1;1,1,0;1,0,1;0,1,1]);
 title ("pie() with exploded wedge");
Produces the following figure
| Figure 1 |
|---|
 |
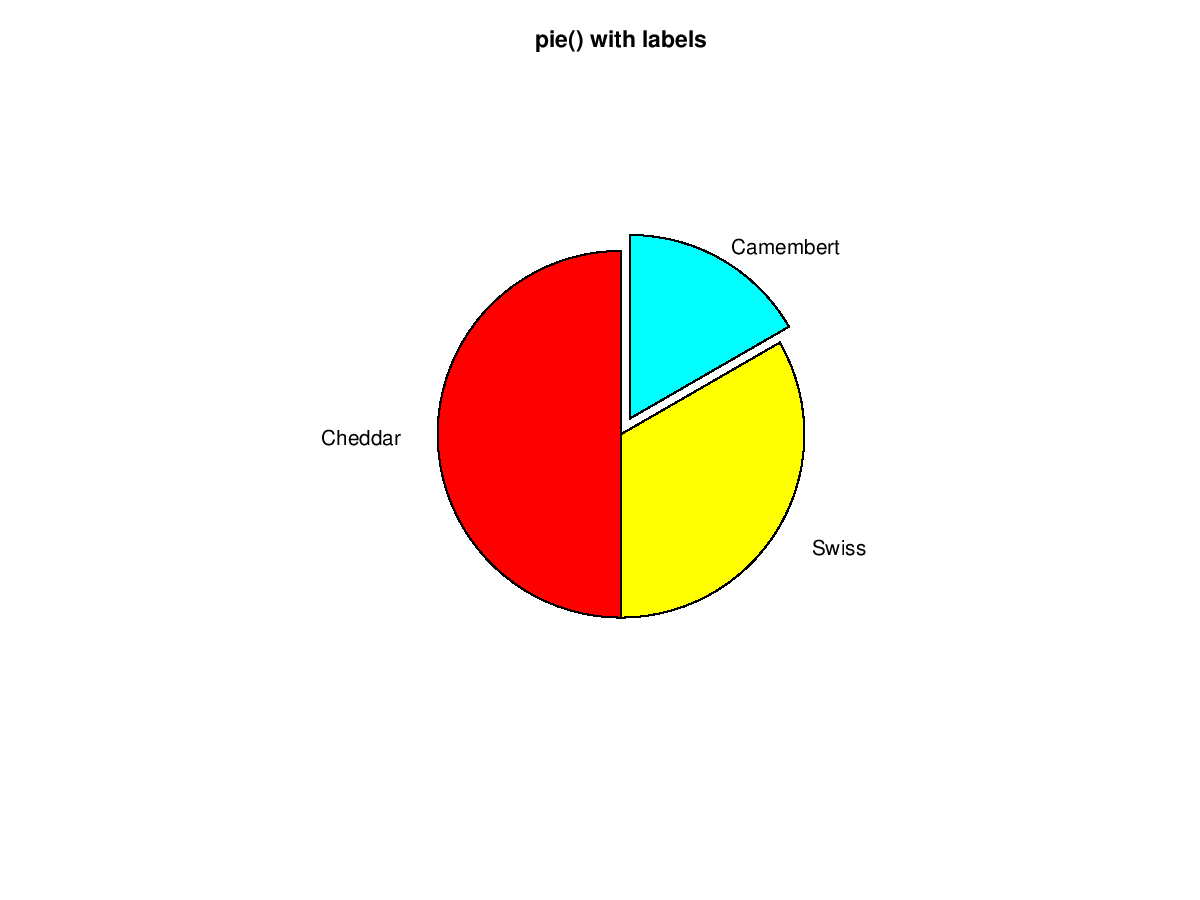
The following code
 clf;
 pie ([3, 2, 1], [0, 0, 1], {"Cheddar", "Swiss", "Camembert"});
 colormap ([1,0,0;0,1,0;0,0,1;1,1,0;1,0,1;0,1,1]);
 axis ([-2,2,-2,2]);
 title ("pie() with labels");
Produces the following figure
| Figure 1 |
|---|
 |
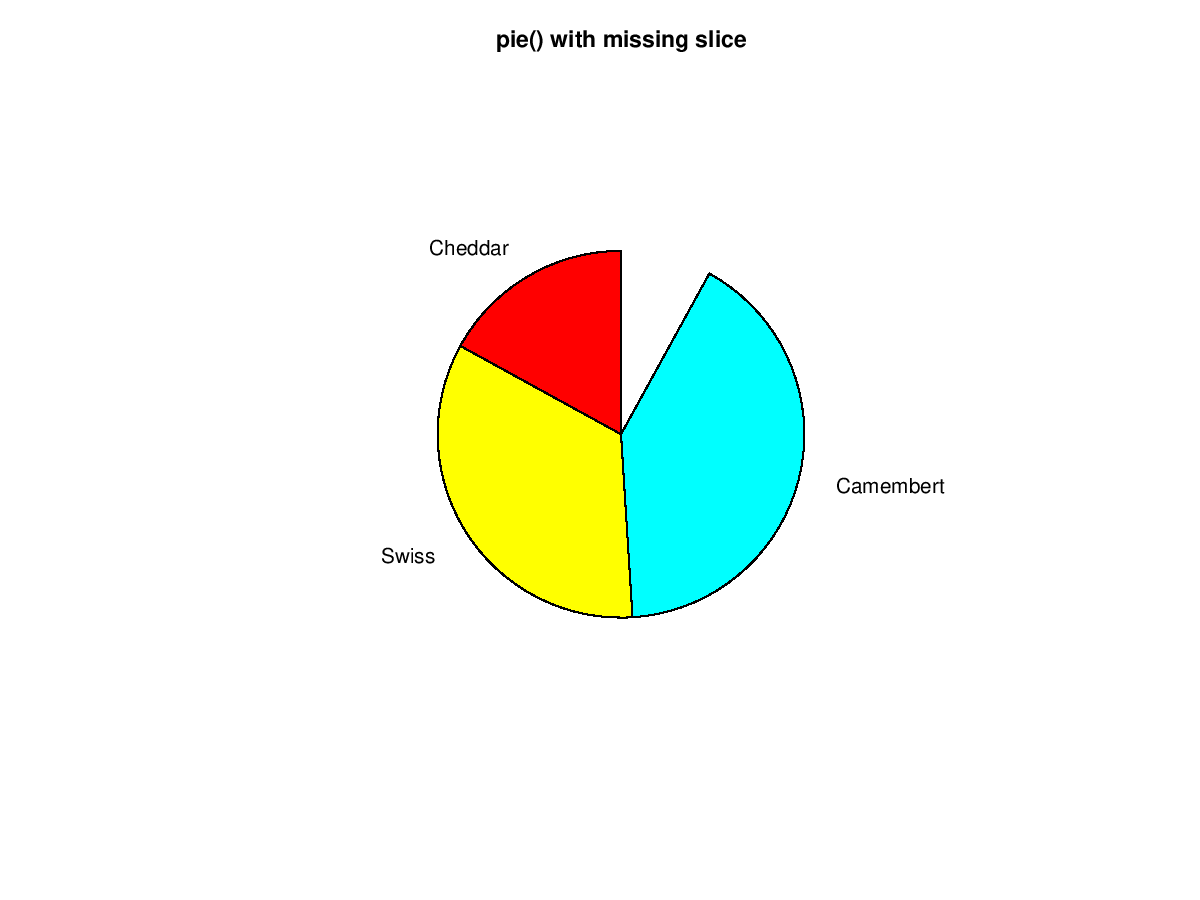
The following code
 clf;
 pie ([0.17, 0.34, 0.41], {"Cheddar", "Swiss", "Camembert"});
 colormap ([1,0,0;0,1,0;0,0,1;1,1,0;1,0,1;0,1,1]);
 axis ([-2,2,-2,2]);
 title ("pie() with missing slice");
Produces the following figure
| Figure 1 |
|---|
 |
Package: octave