
|
Octave-Forge - Extra packages for GNU Octave |
| Home · Packages · Developers · Documentation · FAQ · Bugs · Mailing Lists · Links · Code |
|
|
Octave-Forge - Extra packages for GNU Octave |
| Home · Packages · Developers · Documentation · FAQ · Bugs · Mailing Lists · Links · Code |
Plot two sets of data with independent y-axes and a common x-axis.
The arguments x1 and y1 define the arguments for the first plot and x1 and y2 for the second.
By default the arguments are evaluated with
feval (@plot, x, y). However the type of plot can be
modified with the fun argument, in which case the plots are
generated by feval (fun, x, y). fun can be
a function handle, an inline function, or a string of a function name.
The function to use for each of the plots can be independently defined with fun1 and fun2.
If the first argument hax is an axes handle, then it defines the principal axis in which to plot the x1 and y1 data.
The return value ax is a vector with the axis handles of the two y-axes. h1 and h2 are handles to the objects generated by the plot commands.
x = 0:0.1:2*pi;
y1 = sin (x);
y2 = exp (x - 1);
ax = plotyy (x, y1, x - 1, y2, @plot, @semilogy);
xlabel ("X");
ylabel (ax(1), "Axis 1");
ylabel (ax(2), "Axis 2");
See also: plot.
The following code
 clf;
 x = 0:0.1:2*pi;
 y1 = sin (x);
 y2 = exp (x - 1);
 ax = plotyy (x,y1, x-1,y2, @plot, @semilogy);
 xlabel ("X");
 ylabel (ax(1), "Axis 1");
 ylabel (ax(2), "Axis 2");
 lcolor = get (gca, "ColorOrder")(1,:);
 rcolor = get (gca, "ColorOrder")(2,:);
 text (0.5, 0.5, "Left Axis", ...
       "color", lcolor, "horizontalalignment", "center", "parent", ax(1));
 text (4.5, 80, "Right Axis", ...
       "color", rcolor, "horizontalalignment", "center", "parent", ax(2));
 title ({"plotyy() example"; "left axis uses @plot, right axis uses @semilogy"});
Produces the following figure
| Figure 1 |
|---|
 |
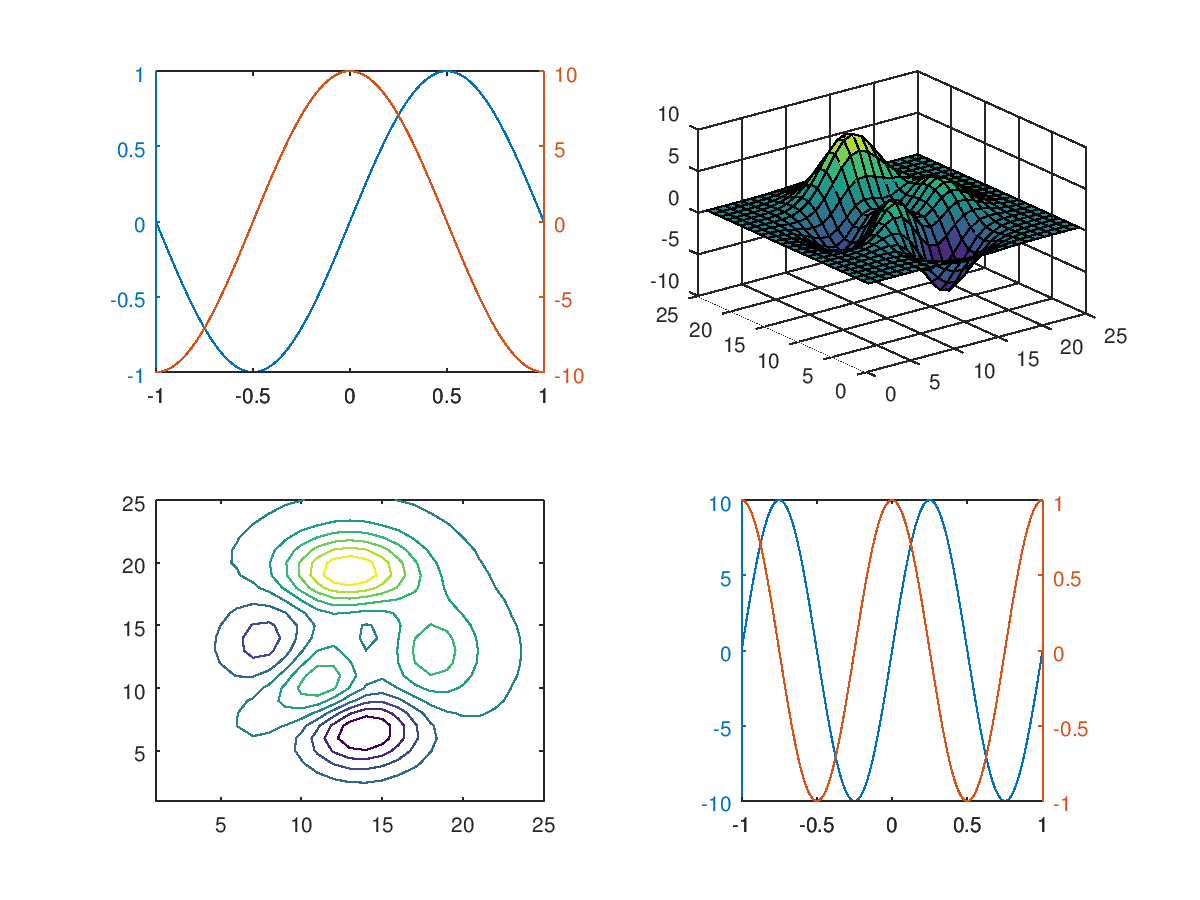
The following code
 clf;
 colormap ("default");
 x = linspace (-1, 1, 201);
 subplot (2,2,1);
  plotyy (x,sin(pi*x), x,10*cos(pi*x));
 subplot (2,2,2);
  surf (peaks (25));
 subplot (2,2,3);
  contour (peaks (25));
 subplot (2,2,4);
  plotyy (x,10*sin(2*pi*x), x,cos(2*pi*x));
  axis square;
Produces the following figure
| Figure 1 |
|---|
 |
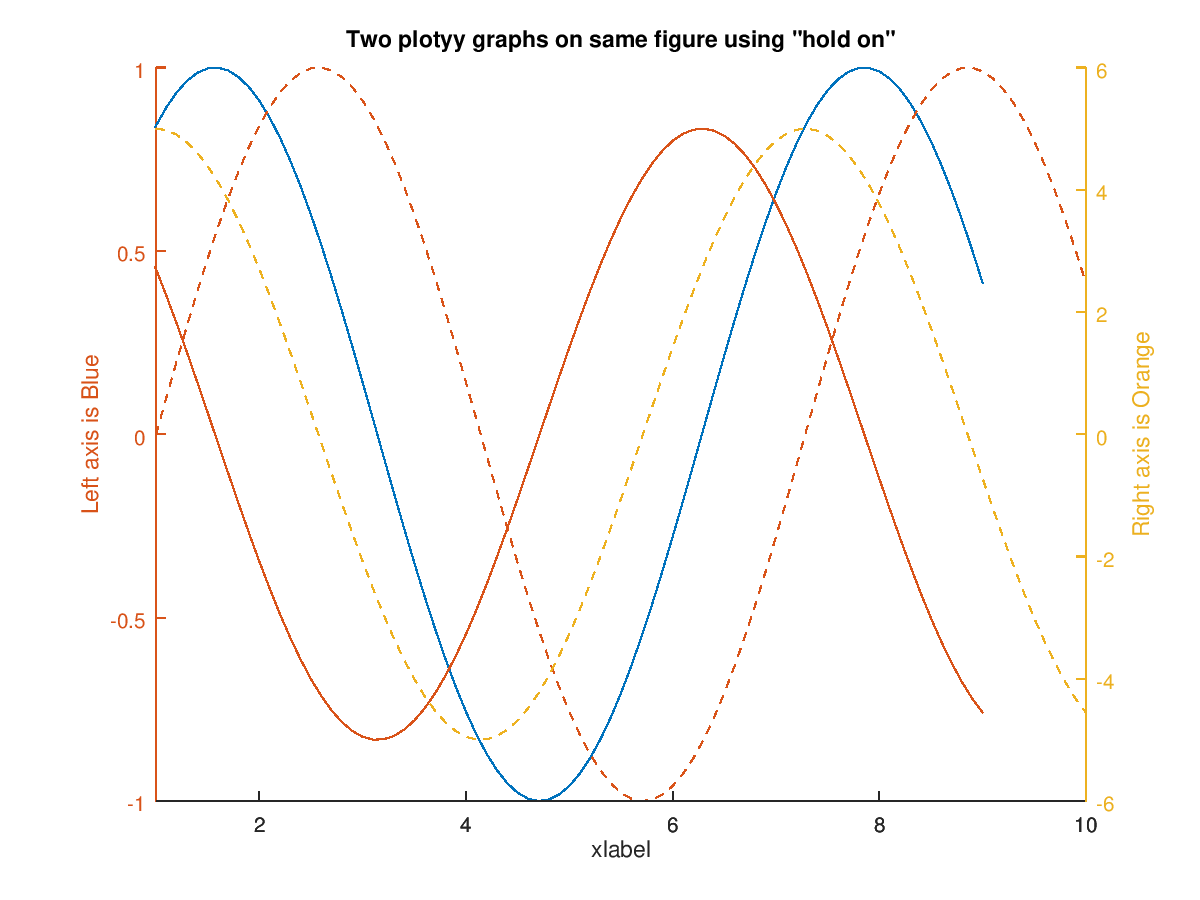
The following code
 clf;
 hold on
 t = (0:0.1:9);
 x = sin (t);
 y = 5 * cos (t);
 [hax, h1, h2] = plotyy (t, x, t, y);
 [~, h3, h4] = plotyy (t+1, x, t+1, y);
 set ([h3, h4], "linestyle", "--");
 xlabel (hax(1), "xlabel");
 title (hax(2), 'Two plotyy graphs on same figure using "hold on"');
 ylabel (hax(1), "Left axis is Blue");
 ylabel (hax(2), "Right axis is Orange");
Produces the following figure
| Figure 1 |
|---|
 |
Package: octave