
|
Octave-Forge - Extra packages for GNU Octave |
| Home · Packages · Developers · Documentation · FAQ · Bugs · Mailing Lists · Links · Code |
|
|
Octave-Forge - Extra packages for GNU Octave |
| Home · Packages · Developers · Documentation · FAQ · Bugs · Mailing Lists · Links · Code |
Evaluate any ‘datasource’ properties of the current figure and update the plot if the corresponding data has changed.
If the first argument h is a list of graphic handles, then operate
on these objects rather than the current figure returned by gcf.
The optional second argument workspace can take the following values:
"base"Evaluate the datasource properties in the base workspace. (default).
"caller"Evaluate the datasource properties in the workspace of the function
that called refreshdata.
An example of the use of refreshdata is:
x = 0:0.1:10;
y = sin (x);
plot (x, y, "ydatasource", "y");
for i = 1 : 100
  pause (0.1);
  y = sin (x + 0.1*i);
  refreshdata ();
endfor
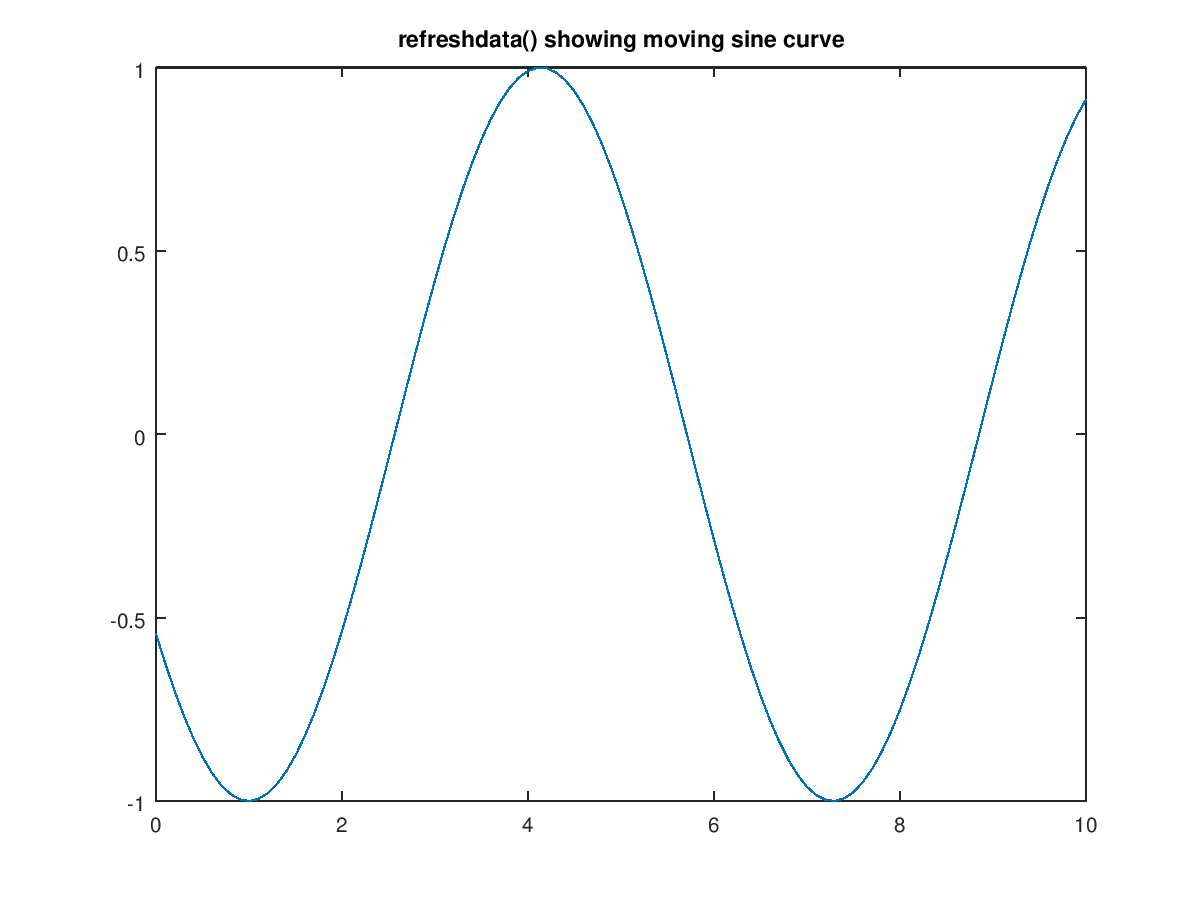
The following code
 clf;
 x = 0:0.1:10;
 y = sin (x);
 plot (x, y, "ydatasource", "y");
 title ("refreshdata() showing moving sine curve");
 axis manual;
 for i = 1 : 100
   pause (0);
   y = sin (x + 0.1 * i);
   refreshdata (gcf, "caller");
 endfor
Produces the following figure
| Figure 1 |
|---|
 |
Package: octave