
|
Octave-Forge - Extra packages for GNU Octave |
| Home · Packages · Developers · Documentation · FAQ · Bugs · Mailing Lists · Links · Code |
|
|
Octave-Forge - Extra packages for GNU Octave |
| Home · Packages · Developers · Documentation · FAQ · Bugs · Mailing Lists · Links · Code |
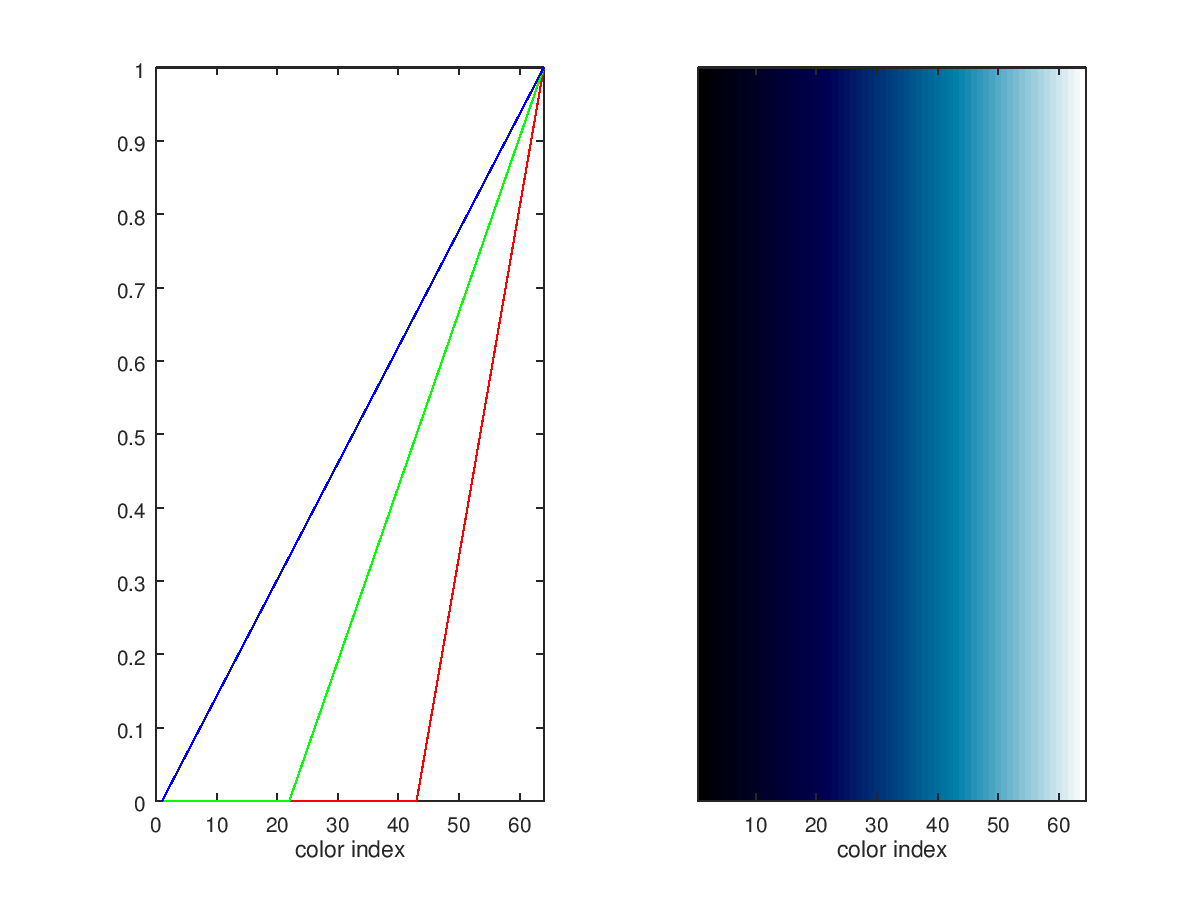
Plot the components of a colormap.
Two different styles are available for displaying the cmap:
Plot the RGB line profile of the colormap for each of the channels (red, green and blue) with the plot lines colored appropriately. Each line represents the intensity of an RGB component across the colormap.
Draw the colormap across the X-axis so that the actual index colors are visible rather than the individual color components.
The optional return value h is a graphics handle to the created plot.
Run demo rgbplot to see an example of rgbplot and each style
option.
See also: colormap.
The following code
 clf;
 subplot (1, 2, 1);
  rgbplot (ocean, "profile");
 subplot (1, 2, 2);
  rgbplot (ocean, "composite");
Produces the following figure
| Figure 1 |
|---|
 |
Package: octave