
|
Octave-Forge - Extra packages for GNU Octave |
| Home · Packages · Developers · Documentation · FAQ · Bugs · Mailing Lists · Links · Code |
|
|
Octave-Forge - Extra packages for GNU Octave |
| Home · Packages · Developers · Documentation · FAQ · Bugs · Mailing Lists · Links · Code |
Plot an angular histogram.
With one vector argument, th, plot the histogram with 20 angular bins. If th is a matrix then each column of th produces a separate histogram.
If nbins is given and is a scalar, then the histogram is produced with nbin bins. If bins is a vector, then the center of each bin is defined by the values in bins and the number of bins is given by the number of elements in bins.
If the first argument hax is an axes handle, then plot into this axis,
rather than the current axes returned by gca.
The optional return value h is a vector of graphics handles to the line objects representing each histogram.
If two output arguments are requested then no plot is made and the polar vectors necessary to plot the histogram are returned instead.
Example
[th, r] = rose ([2*randn(1e5,1), pi + 2*randn(1e5,1)]);
polar (th, r);
Programming Note: When specifying bin centers with the bins input,
the edges for bins 2 to N-1 are spaced so that bins(i) is
centered between the edges. The final edge is drawn halfway between bin N
and bin 1. This guarantees that all input th will be placed into one
of the bins, but also means that for some combinations bin 1 and bin N may
not be centered on the user’s given values.
See also: hist, polar.
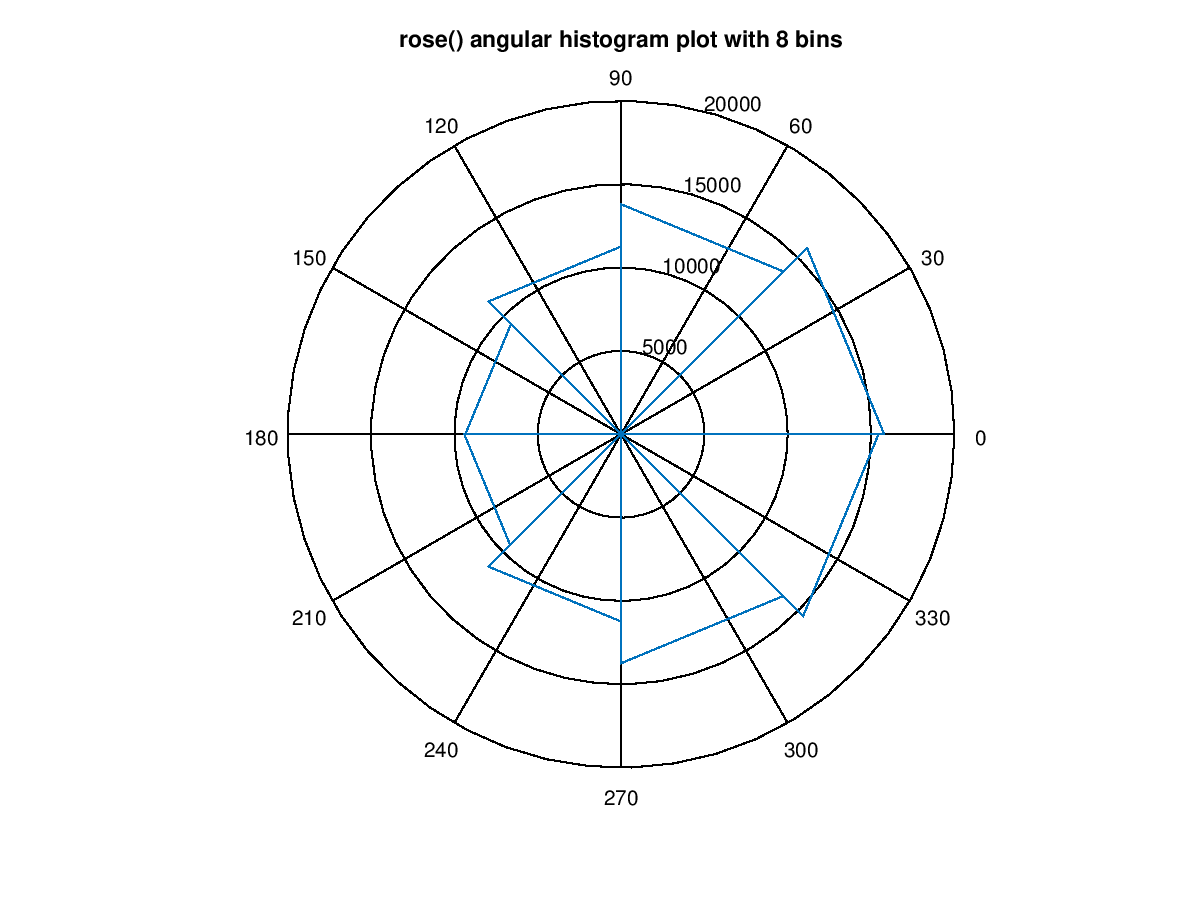
The following code
 clf;
 rose (2*randn (1e5, 1), 8);
 title ("rose() angular histogram plot with 8 bins");
Produces the following figure
| Figure 1 |
|---|
 |
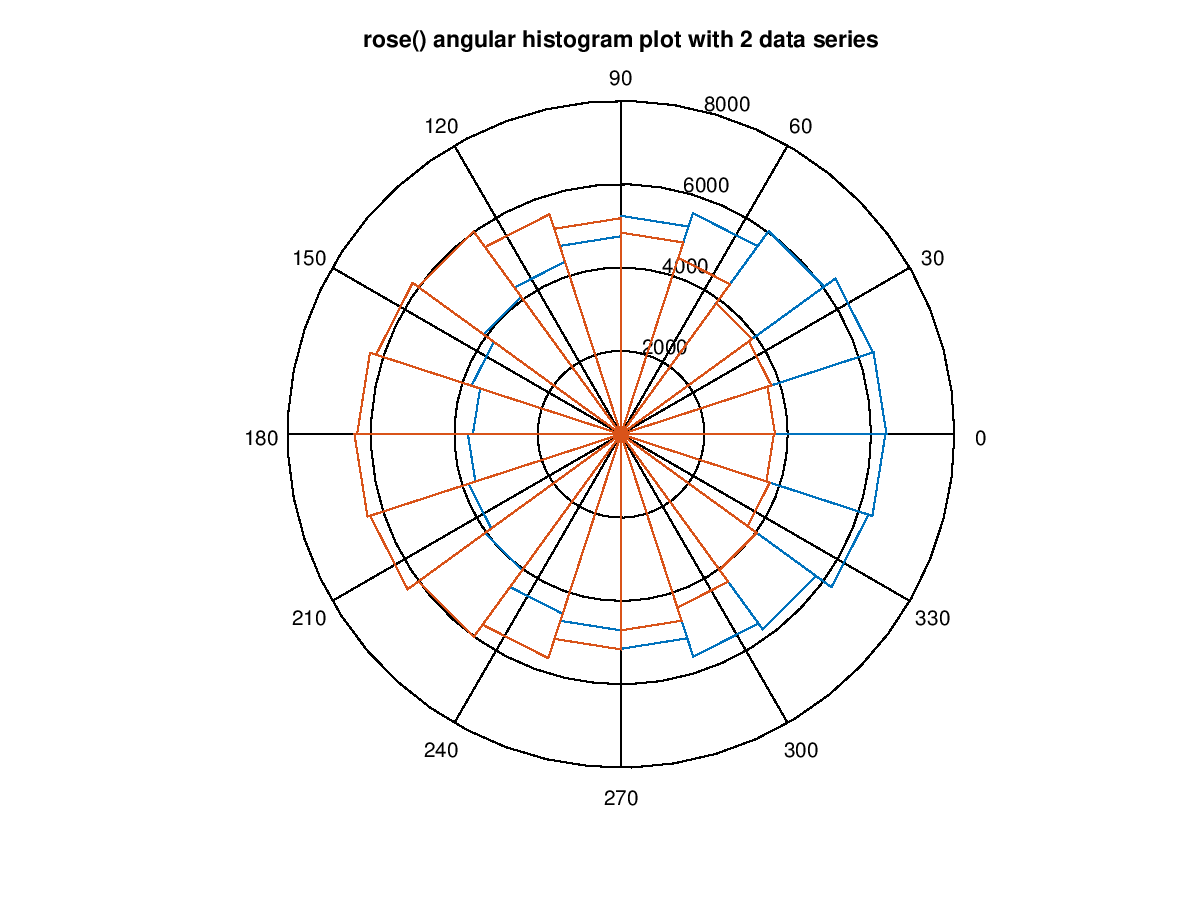
The following code
 clf;
 rose ([2*randn(1e5, 1), pi + 2*randn(1e5, 1)]);
 title ("rose() angular histogram plot with 2 data series");
Produces the following figure
| Figure 1 |
|---|
 |
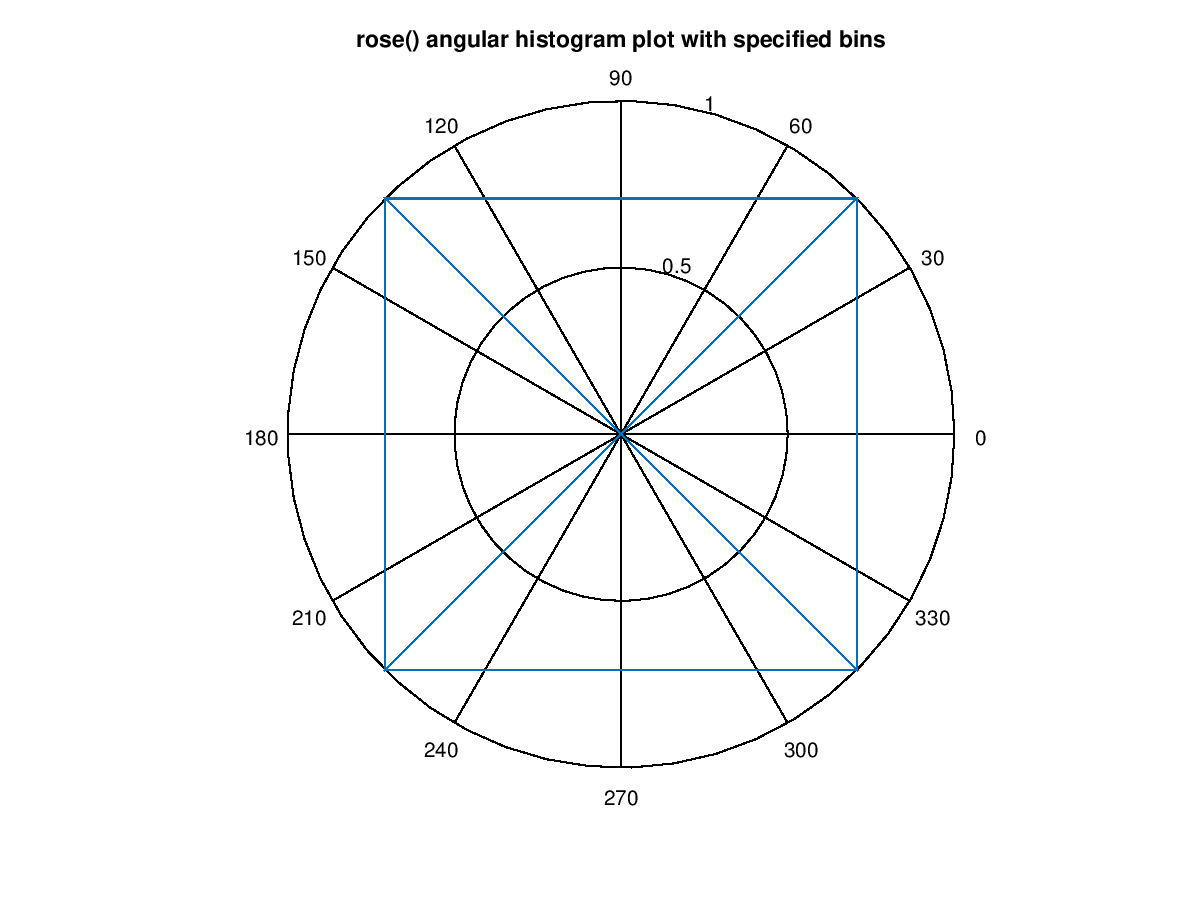
The following code
 clf;
 rose ([0, 2, 3, 5], [0, pi/2, pi, 3*pi/2]);
 title ("rose() angular histogram plot with specified bins");
Produces the following figure
| Figure 1 |
|---|
 |
Package: octave