
|
Octave-Forge - Extra packages for GNU Octave |
| Home · Packages · Developers · Documentation · FAQ · Bugs · Mailing Lists · Links · Code |
|
|
Octave-Forge - Extra packages for GNU Octave |
| Home · Packages · Developers · Documentation · FAQ · Bugs · Mailing Lists · Links · Code |
Plot slices of 3-D data/scalar fields.
Each element of the 3-dimensional array v represents a scalar value at
a location given by the parameters x, y, and z. The
parameters x, x, and z are either 3-dimensional arrays of
the same size as the array v in the "meshgrid" format or
vectors. The parameters xi, etc. respect a similar format to
x, etc., and they represent the points at which the array vi
is interpolated using interp3. The vectors sx, sy, and
sz contain points of orthogonal slices of the respective axes.
If x, y, z are omitted, they are assumed to be
x = 1:size (v, 2), y = 1:size (v, 1) and
z = 1:size (v, 3).
method is one of:
"nearest"Return the nearest neighbor.
"linear"Linear interpolation from nearest neighbors.
"cubic"Cubic interpolation from four nearest neighbors (not implemented yet).
"spline"Cubic spline interpolation—smooth first and second derivatives throughout the curve.
The default method is "linear".
If the first argument hax is an axes handle, then plot into this axis,
rather than the current axes returned by gca.
The optional return value h is a graphics handle to the created surface object.
Examples:
[x, y, z] = meshgrid (linspace (-8, 8, 32));
v = sin (sqrt (x.^2 + y.^2 + z.^2)) ./ (sqrt (x.^2 + y.^2 + z.^2));
slice (x, y, z, v, [], 0, []);

[xi, yi] = meshgrid (linspace (-7, 7));
zi = xi + yi;
slice (x, y, z, v, xi, yi, zi);
See also: interp3, surface, pcolor.
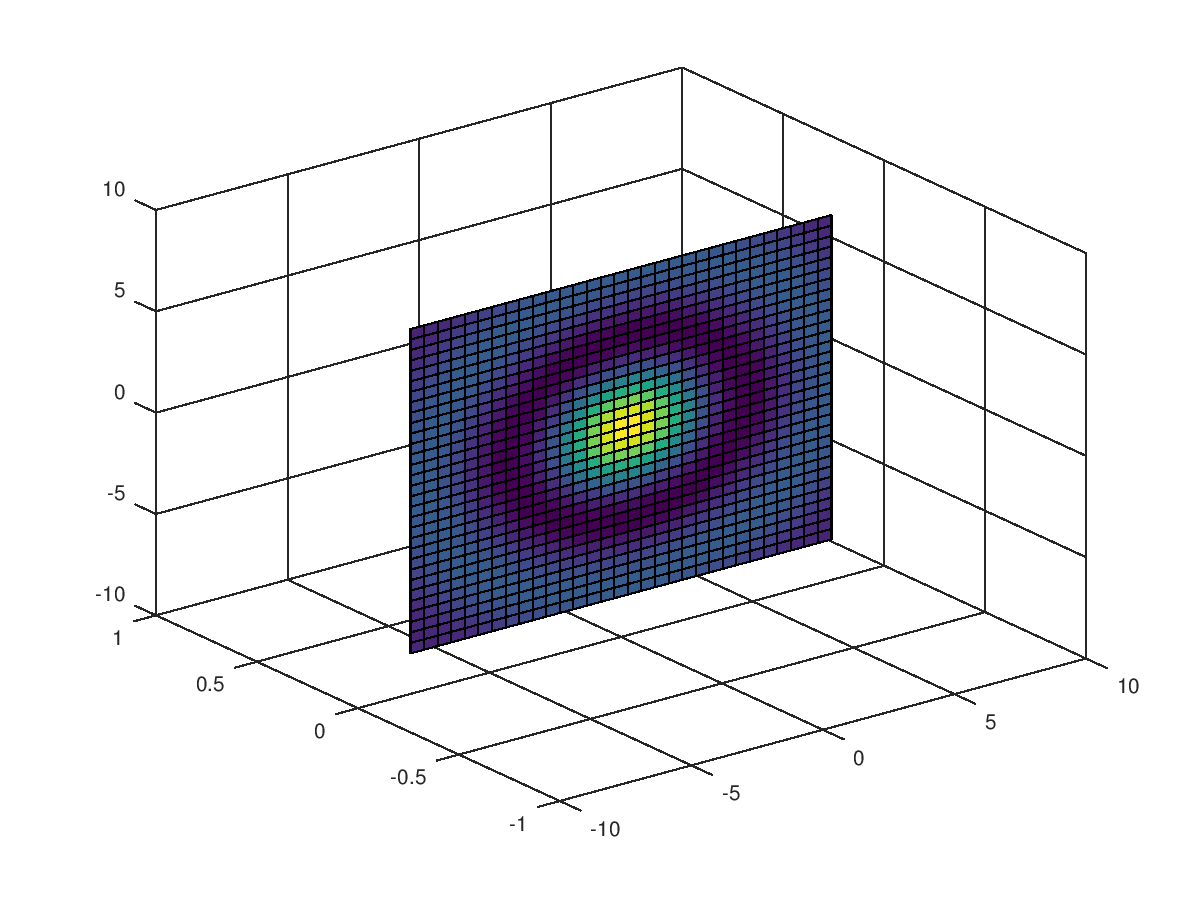
The following code
 clf;
 colormap ("default");
 [x, y, z] = meshgrid (linspace (-8, 8, 32));
 v = sin (sqrt (x.^2 + y.^2 + z.^2)) ./ (sqrt (x.^2 + y.^2 + z.^2));
 slice (x, y, z, v, [], 0, []);
Produces the following figure
| Figure 1 |
|---|
 |
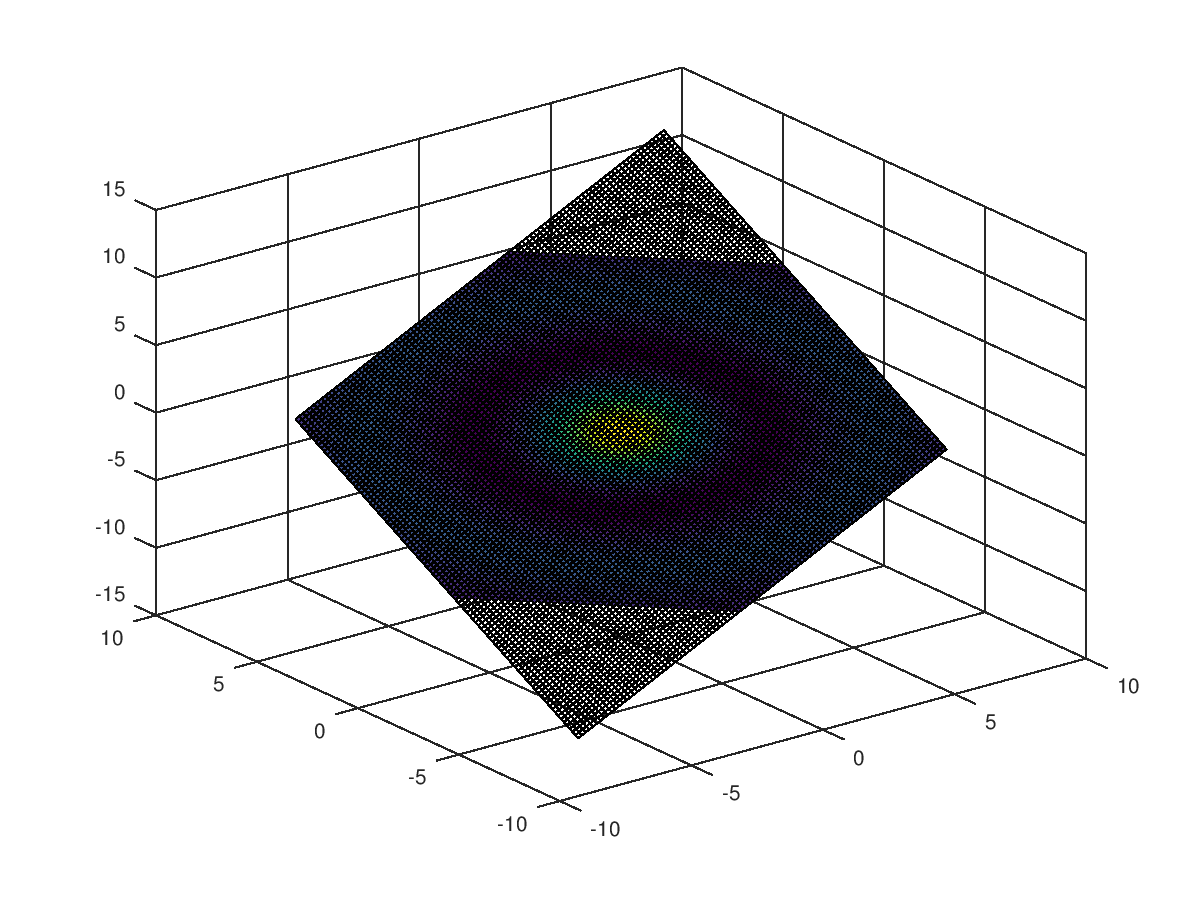
The following code
 clf;
 colormap ("default");
 [x, y, z] = meshgrid (linspace (-8, 8, 32));
 v = sin (sqrt (x.^2 + y.^2 + z.^2)) ./ (sqrt (x.^2 + y.^2 + z.^2));
 [xi, yi] = meshgrid (linspace (-7, 7));
 zi = xi + yi;
 slice (x, y, z, v, xi, yi, zi);
Produces the following figure
| Figure 1 |
|---|
 |
Package: octave