
|
Octave-Forge - Extra packages for GNU Octave |
| Home · Packages · Developers · Documentation · FAQ · Bugs · Mailing Lists · Links · Code |
|
|
Octave-Forge - Extra packages for GNU Octave |
| Home · Packages · Developers · Documentation · FAQ · Bugs · Mailing Lists · Links · Code |
Produce a stairstep plot.
The arguments x and y may be vectors or matrices. If only one argument is given, it is taken as a vector of Y values and the X coordinates are taken to be the indices of the elements.
The style to use for the plot can be defined with a line style style
of the same format as the plot command.
Multiple property/value pairs may be specified, but they must appear in pairs.
If the first argument hax is an axis handle, then plot into this axis,
rather than the current axis handle returned by gca.
If one output argument is requested, return a graphics handle to the created plot. If two output arguments are specified, the data are generated but not plotted. For example,
stairs (x, y);
and
[xs, ys] = stairs (x, y);
plot (xs, ys);
are equivalent.
See also: bar, hist, plot, stem.
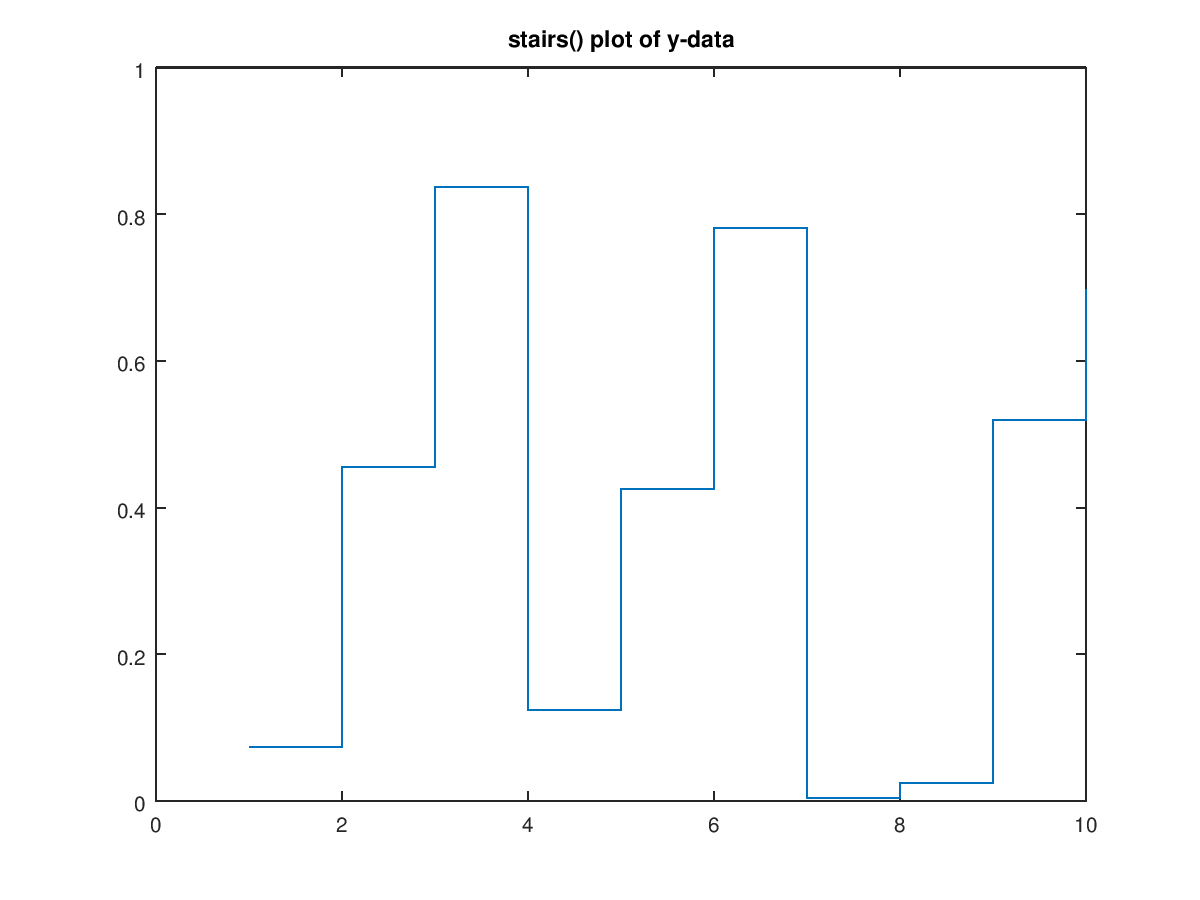
The following code
 clf;
 rand_1x10_data1 = [0.073, 0.455, 0.837, 0.124, 0.426, 0.781, 0.004, 0.024, 0.519, 0.698];
 y = rand_1x10_data1;
 stairs (y);
 title ('stairs() plot of y-data');
Produces the following figure
| Figure 1 |
|---|
 |
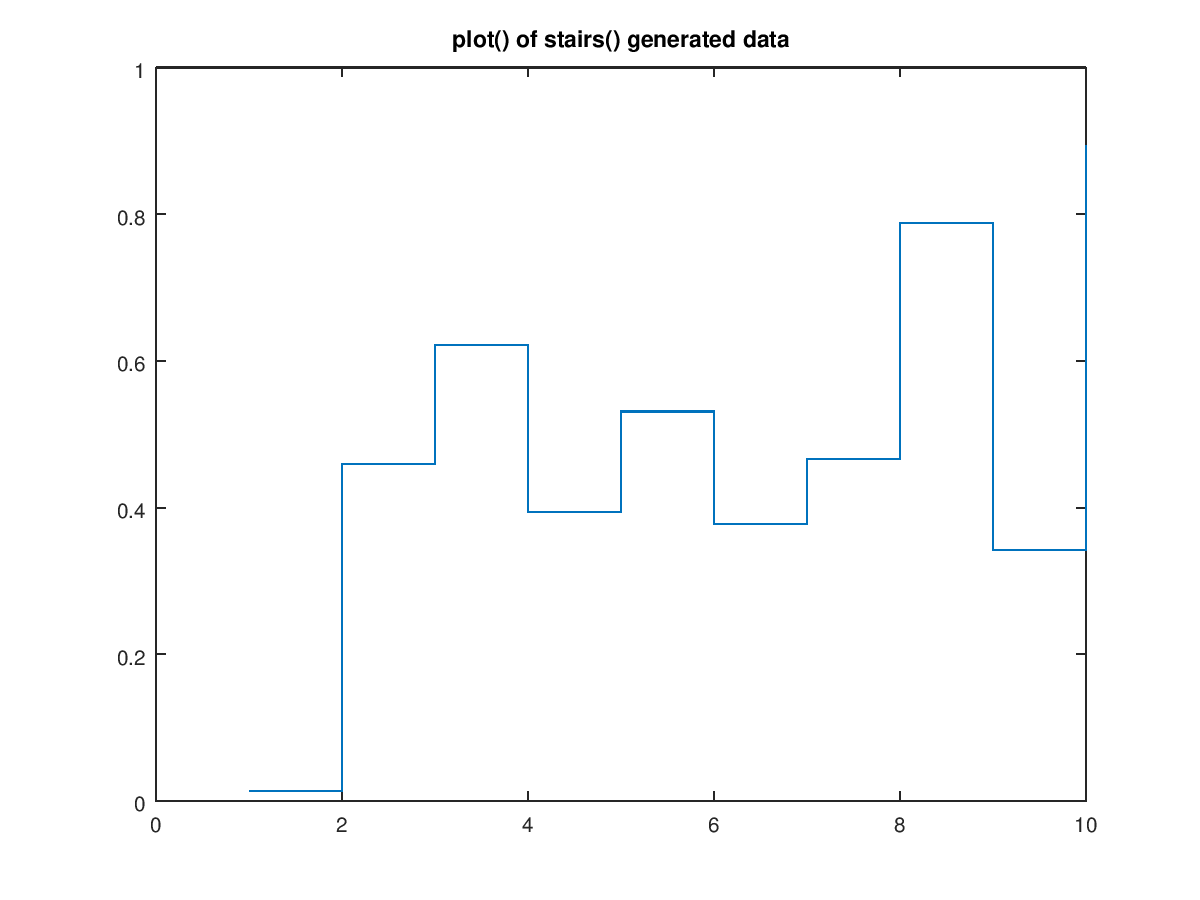
The following code
 clf;
 x = 1:10;
 rand_1x10_data2 = [0.014, 0.460, 0.622, 0.394, 0.531, 0.378, 0.466, 0.788, 0.342, 0.893];
 y = rand_1x10_data2;
 [xs, ys] = stairs (x, y);
 plot (xs, ys);
 title ("plot() of stairs() generated data");
Produces the following figure
| Figure 1 |
|---|
 |
The following code
 clf;
 stairs (1:9, "-o");
 title ("stairs() plot with linespec to modify marker");
Produces the following figure
| Figure 1 |
|---|
 |
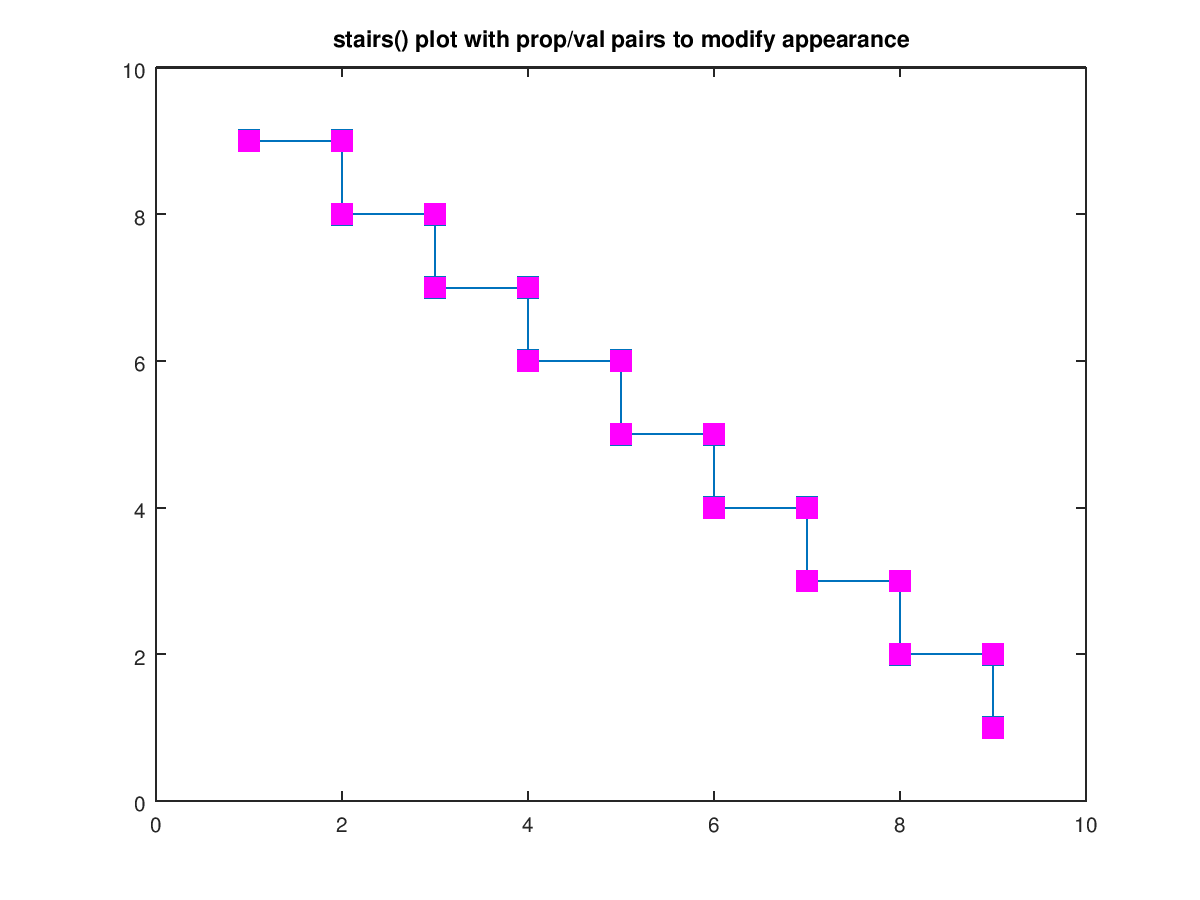
The following code
 clf;
 stairs (9:-1:1, "marker", "s", "markersize", 10, "markerfacecolor", "m");
 title ("stairs() plot with prop/val pairs to modify appearance");
Produces the following figure
| Figure 1 |
|---|
 |
The following code
 clf;
 N = 11;
 x = 0:(N-1);
 y = rand (1, N);
 hs = stairs (x(1), y(1));
 axis ([1, N-1 0, 1]);
 title ("stairs plot data modified through handle");
 for k = 2:N
   set (hs, "xdata", x(1:k), "ydata", y(1:k));
   drawnow ();
   pause (0.2);
 endfor
Produces the following figure
| Figure 1 |
|---|
 |
Package: octave