
|
Octave-Forge - Extra packages for GNU Octave |
| Home · Packages · Developers · Documentation · FAQ · Bugs · Mailing Lists · Links · Code |
|
|
Octave-Forge - Extra packages for GNU Octave |
| Home · Packages · Developers · Documentation · FAQ · Bugs · Mailing Lists · Links · Code |
Set up a plot grid with rows by cols subwindows and set the
current axes for plotting (gca) to the location given by index.
If only one numeric argument is supplied, then it must be a three digit value specifying the number of rows in digit 1, the number of columns in digit 2, and the plot index in digit 3.
The plot index runs row-wise; First, all columns in a row are numbered and then the next row is filled.
For example, a plot with 2x3 grid will have plot indices running as follows:
+-----+-----+-----+
| 1  | 2  | 3  |
+-----+-----+-----+
| 4  | 5  | 6  |
+-----+-----+-----+
index may also be a vector. In this case, the new axis will enclose the grid locations specified. The first demo illustrates this:
demo ("subplot", 1)
The index of the subplot to make active may also be specified by its axes
handle, hax, returned from a previous subplot command.
If the option "align" is given then the plot boxes of the subwindows
will align, but this may leave no room for axis tick marks or labels.
If the option "replace" is given then the subplot axis will be
reset, rather than just switching the current axis for plotting to the
requested subplot.
The "position" property can be used to exactly position the subplot
axes within the current figure. The option pos is a 4-element vector
[x, y, width, height] that determines the location and size of the axes.
The values in pos are normalized in the range [0,1].
Any property/value pairs are passed directly to the underlying axes object.
If the output hax is requested, subplot returns the axis handle for
the subplot. This is useful for modifying the properties of a subplot
using set.
See also: axes, plot, gca, set.
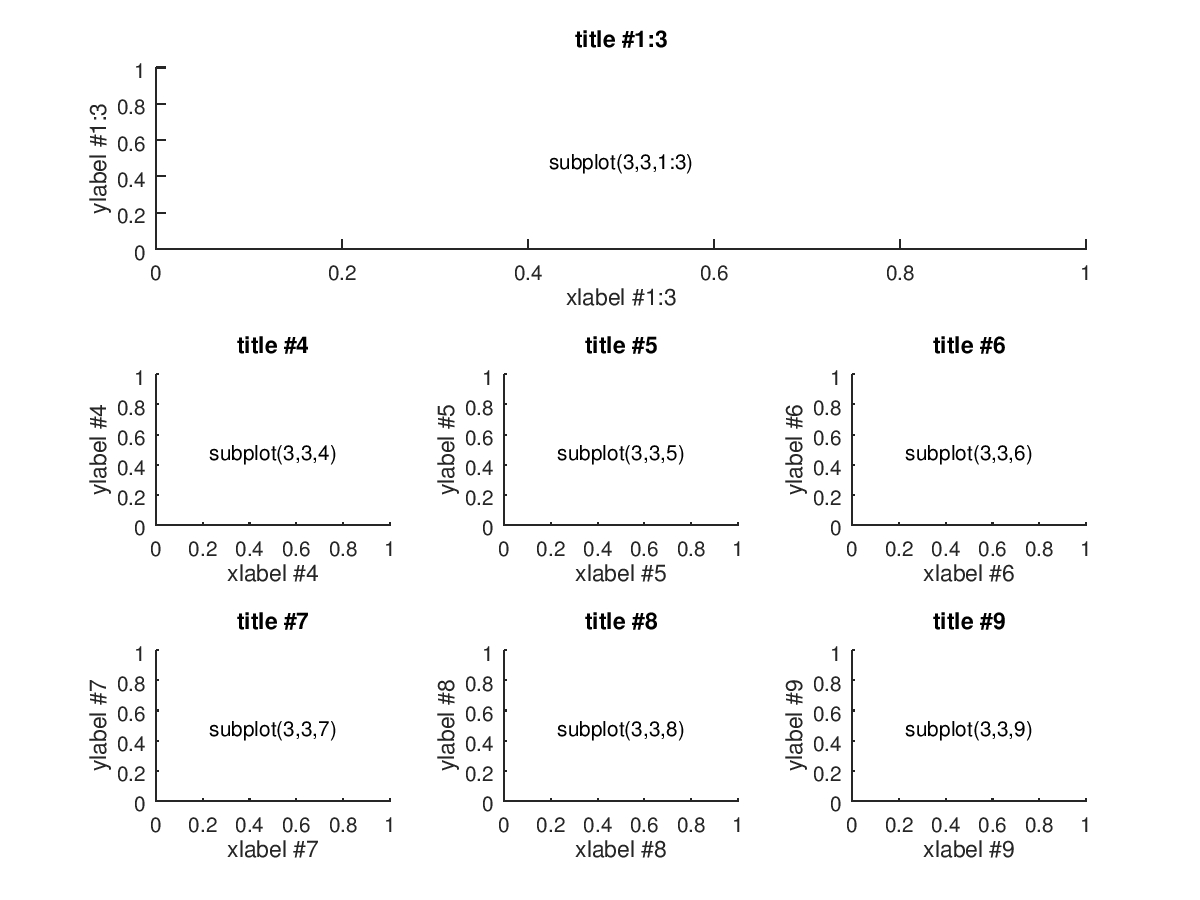
The following code
 clf;
 r = 3;
 c = 3;
 fmt = {"horizontalalignment", "center", "verticalalignment", "middle"};
 for n = 1 : r*c
   subplot (r, c, n);
    xlabel (sprintf ("xlabel #%d", n));
    ylabel (sprintf ("ylabel #%d", n));
    title (sprintf ("title #%d", n));
    text (0.5, 0.5, sprintf ("subplot(%d,%d,%d)", r, c, n), fmt{:});
    axis ([0 1 0 1]);
 endfor
 subplot (r, c, 1:3);
  xlabel (sprintf ("xlabel #%d:%d", 1, 3));
  ylabel (sprintf ("ylabel #%d:%d", 1, 3));
  title (sprintf ("title #%d:%d", 1, 3));
  text (0.5, 0.5, sprintf ("subplot(%d,%d,%d:%d)", r, c, 1, 3), fmt{:});
 axis ([0 1 0 1]);
Produces the following figure
| Figure 1 |
|---|
 |
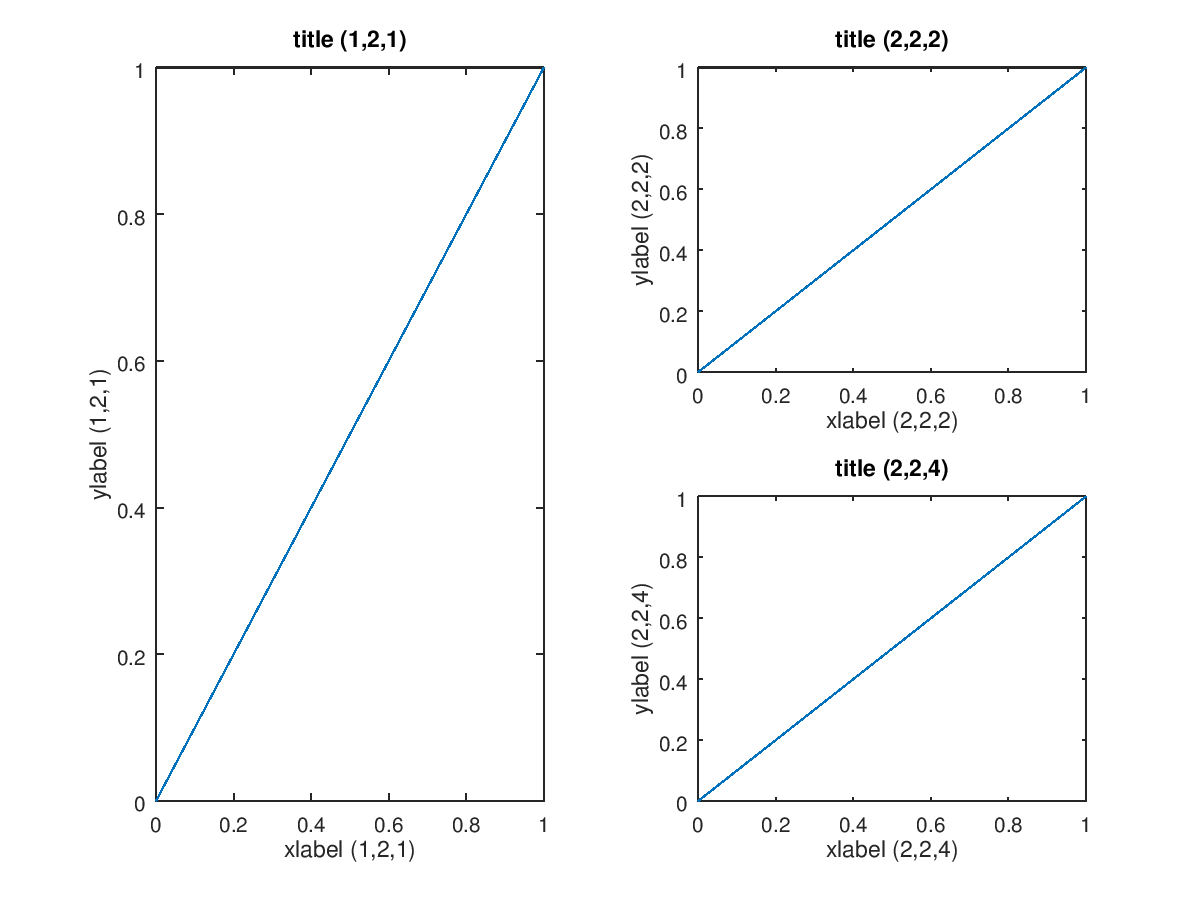
The following code
 clf;
 x = 0:1;
 for n = 1:4
   subplot (2,2,n, "align");
    plot (x, x);
    xlabel (sprintf ("xlabel (2,2,%d)", n));
    ylabel (sprintf ("ylabel (2,2,%d)", n));
    title (sprintf ("title (2,2,%d)", n));
 endfor
 subplot (1,2,1, "align");
  plot (x, x);
  xlabel ("xlabel (1,2,1)");
  ylabel ("ylabel (1,2,1)");
  title ("title (1,2,1)");
Produces the following figure
| Figure 1 |
|---|
 |
The following code
 clf;
 x = 0:10;
 ax(1) = subplot (221);
 set (ax(1), "tag", "1");
 plot (x, rand (3, 11));
 title ("x & y labels & ticklabels");
 xlabel xlabel;
 ylabel ylabel;
 ax(2) = subplot (222);
 set (ax(2), "tag", "2");
 plot (x, rand (3, 11));
 title ("no labels");
 axis ("nolabel","tic");
 ax(3) = subplot (223);
 set (ax(3), "tag", "3");
 plot (x, rand (3, 11));
 title ("no labels");
 axis ("nolabel","tic");
 ax(4) = subplot (224);
 set (ax(4), "tag", "4");
 plot (x, rand (3, 11));
 title ("x & y labels & ticklabels");
 xlabel xlabel;
 ylabel ylabel;
Produces the following figure
| Figure 1 |
|---|
 |
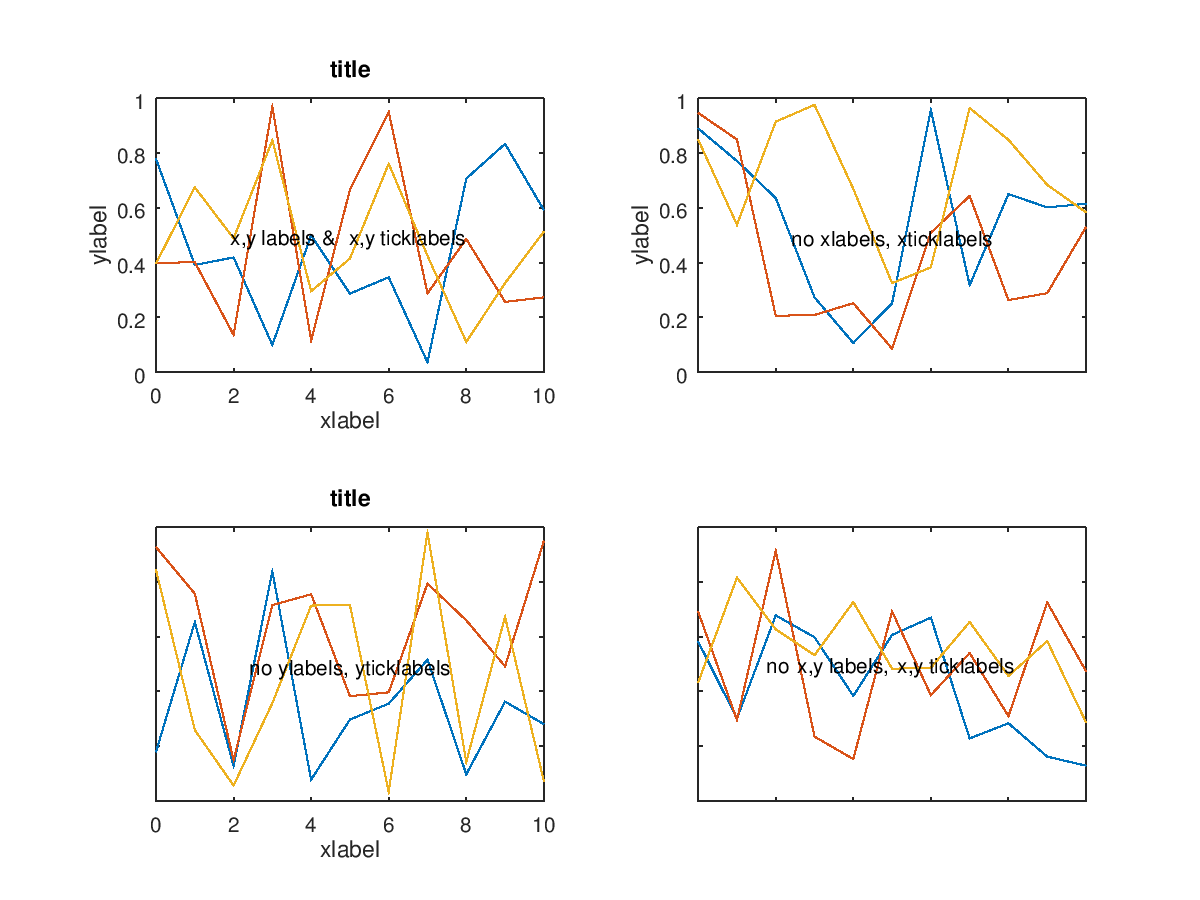
The following code
 x = 0:10;
 subplot (221);
  plot (x, rand (3, 11));
  ylim ([0, 1]);
  text (0.5, 0.5, "{x,y}labels & {x,y}ticklabels", ...
                  "horizontalalignment", "center", ...
                  "units", "normalized");
  xlabel xlabel;
  ylabel ylabel;
  title title;
 subplot (222);
  plot (x, rand (3, 11));
  axis ("labely");
  ylabel ylabel;
  text (0.5, 0.5, "no xlabels, xticklabels", ...
                  "horizontalalignment", "center", ...
                  "units", "normalized");
 subplot (223);
  plot (x, rand (3, 11));
  axis ("labelx");
  text (0.5, 0.5, "no ylabels, yticklabels", ...
                  "horizontalalignment", "center", ...
                  "units", "normalized");
  xlabel xlabel;
  title title;
 subplot (224);
  plot (x, rand (3, 11));
  axis ("nolabel", "tic");
  text (0.5, 0.5, "no {x,y}labels, {x,y}ticklabels", ...
                  "horizontalalignment", "center", ...
                  "units", "normalized");
Produces the following figure
| Figure 1 |
|---|
 |
Package: octave