
|
Octave-Forge - Extra packages for GNU Octave |
| Home · Packages · Developers · Documentation · FAQ · Bugs · Mailing Lists · Links · Code |
|
|
Octave-Forge - Extra packages for GNU Octave |
| Home · Packages · Developers · Documentation · FAQ · Bugs · Mailing Lists · Links · Code |
Display the tetrahedrons defined in the m-by-4 matrix T as 3-D patches.
T is typically the output of a Delaunay triangulation of a 3-D set of points. Every row of T contains four indices into the n-by-3 matrix X of the vertices of a tetrahedron. Every row in X represents one point in 3-D space.
The vector C specifies the color of each tetrahedron as an index into the current colormap. The default value is 1:m where m is the number of tetrahedrons; the indices are scaled to map to the full range of the colormap. If there are more tetrahedrons than colors in the colormap then the values in C are cyclically repeated.
Calling tetramesh (…, "property", "value", …) passes all
property/value pairs directly to the patch function as additional arguments.
The optional return value h is a vector of patch handles where each
handle represents one tetrahedron in the order given by T.
A typical use case for h is to turn the respective patch
"visible" property "on" or "off".
Type demo tetramesh to see examples on using tetramesh.
See also: trimesh, delaunay, delaunayn, patch.
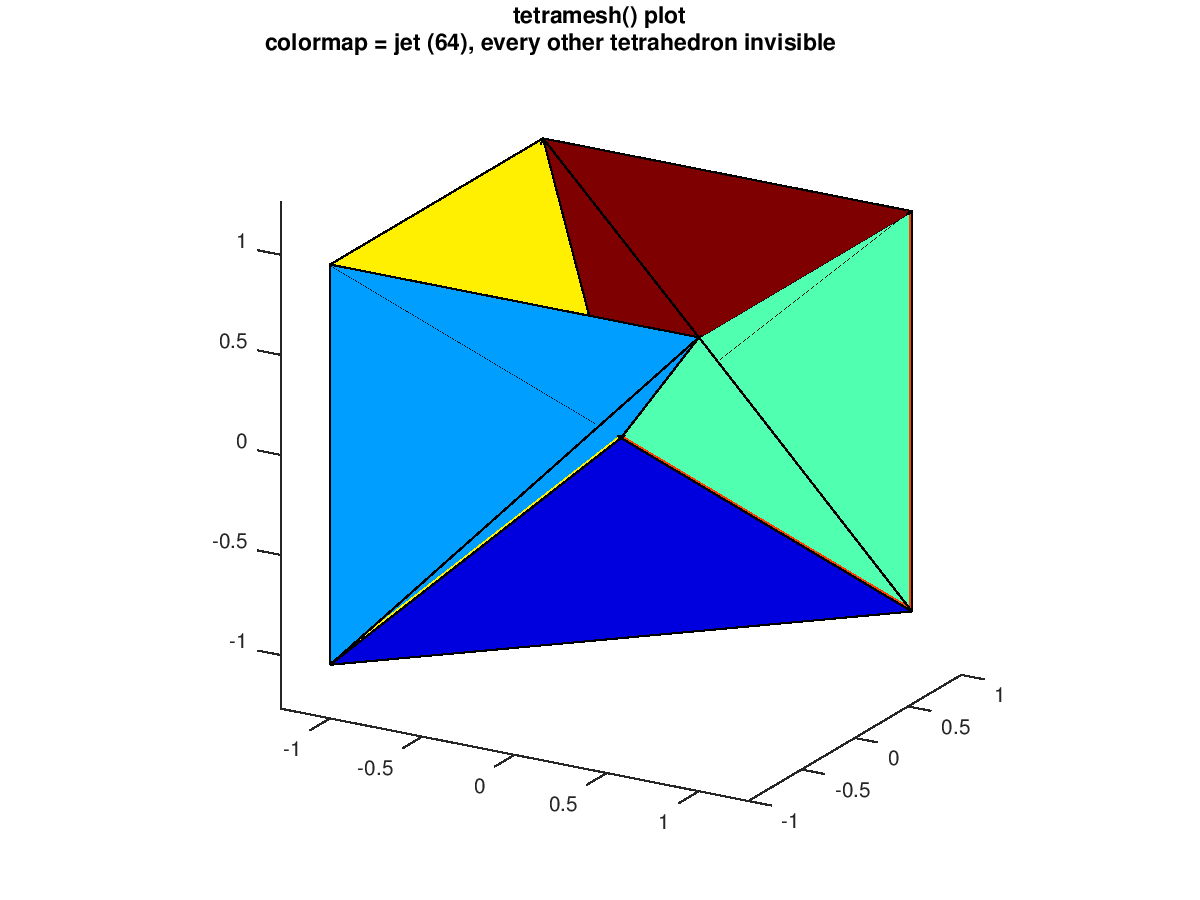
The following code
 clf;
 d = [-1 1];
 [x,y,z] = meshgrid (d, d, d);
 x = [x(:); 0];
 y = [y(:); 0];
 z = [z(:); 0];
 tetra = delaunay (x, y, z);
 X = [x(:) y(:) z(:)];
 colormap (jet (64));
 h = tetramesh (tetra, X);
 set (h(1:2:end), "visible", "off");
 axis equal;
 view (30, 20);
 title ({"tetramesh() plot", ...
         "colormap = jet (64), every other tetrahedron invisible"});
Produces the following figure
| Figure 1 |
|---|
 |
The following code
 clf;
 d = [-1 1];
 [x,y,z] = meshgrid (d, d, d);
 x = [x(:); 0];
 y = [y(:); 0];
 z = [z(:); 0];
 tetra = delaunay (x, y, z);
 X = [x(:) y(:) z(:)];
 colormap (gray (256));
 tetramesh (tetra, X, 21:20:241, "EdgeColor", "w");
 axis equal;
 view (30, 20);
 title ({"tetramesh() plot", ...
         "colormap = gray (256) with white edges"});
Produces the following figure
| Figure 1 |
|---|
 |
Package: octave