
|
Octave-Forge - Extra packages for GNU Octave |
| Home · Packages · Developers · Documentation · FAQ · Bugs · Mailing Lists · Links · Code |
|
|
Octave-Forge - Extra packages for GNU Octave |
| Home · Packages · Developers · Documentation · FAQ · Bugs · Mailing Lists · Links · Code |
Create a text object with text string at position x, y, (z) on the current axes.
Multiple locations can be specified if x, y, (z) are vectors. Multiple strings can be specified with a character matrix or a cell array of strings.
Optional property/value pairs may be used to control the appearance of the text.
The optional return value h is a vector of graphics handles to the created text objects.
See also: gtext, title, xlabel, ylabel, zlabel.
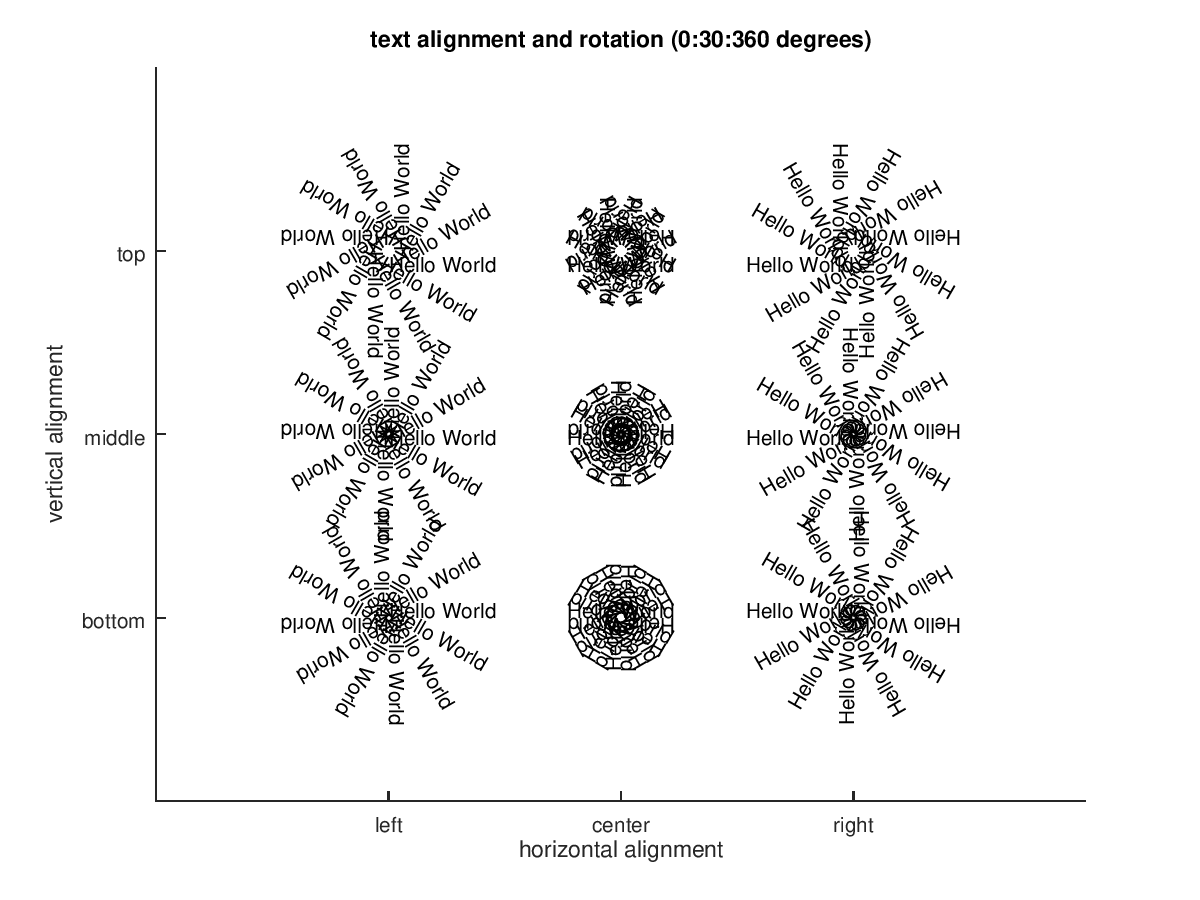
The following code
 clf;
 ha = {"left", "center", "right"};
 va = {"bottom", "middle", "top"};
 x = [0.25 0.5 0.75];
 y = x;
 for t = 0:30:359;
   for nh = 1:numel (ha)
     for nv = 1:numel (va)
       text (x(nh), y(nv), "Hello World", ...
             "rotation", t, ...
             "horizontalalignment", ha{nh}, ...
             "verticalalignment", va{nv});
     endfor
   endfor
 endfor
 set (gca, "xtick", [0.25, 0.5, 0.75], ...
           "xticklabel", ha, ...
           "ytick", [0.25, 0.5, 0.75], ...
           "yticklabel", va);
 axis ([0 1 0 1]);
 xlabel ("horizontal alignment");
 ylabel ("vertical alignment");
 title ("text alignment and rotation (0:30:360 degrees)");
Produces the following figure
| Figure 1 |
|---|
 |
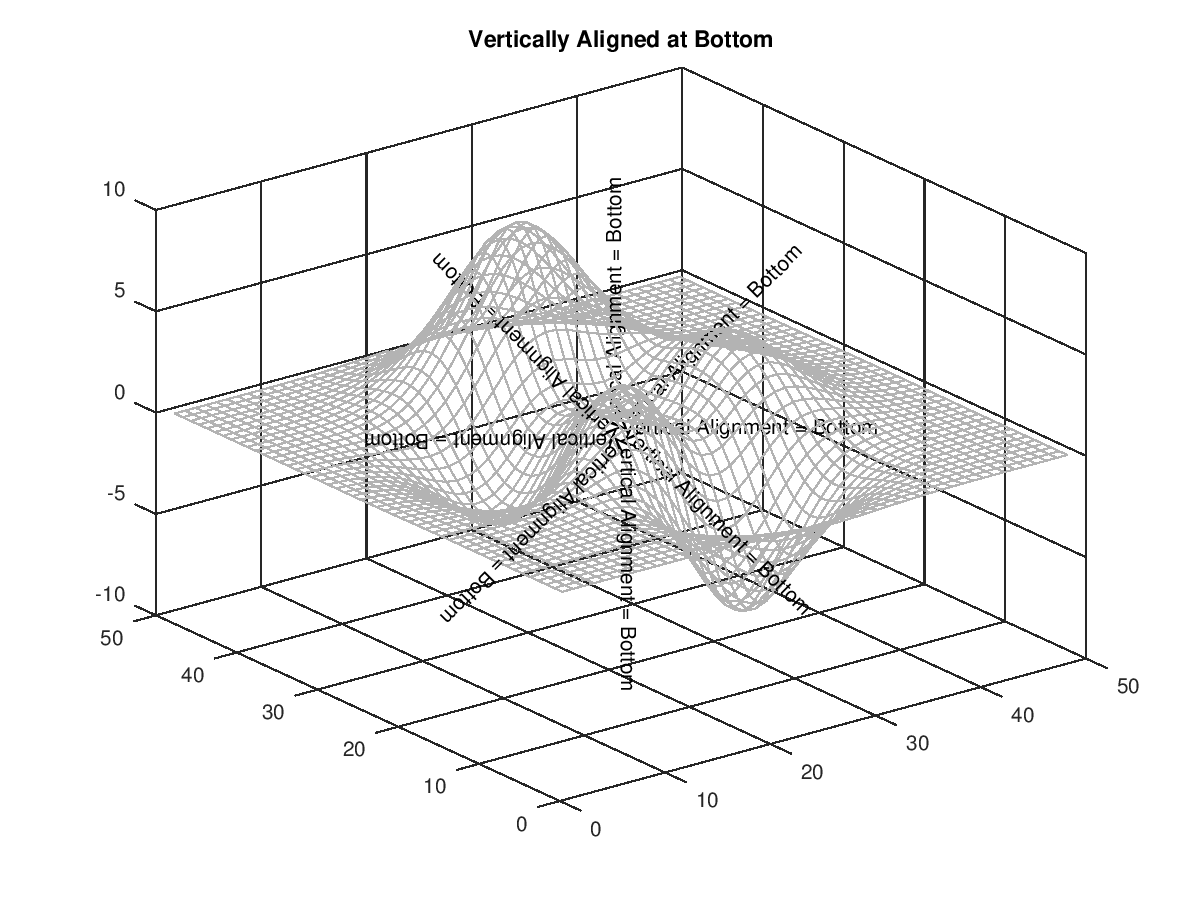
The following code
 clf;
 h = mesh (peaks, "edgecolor", 0.7 * [1 1 1], ...
                  "facecolor", "none", ...
                  "facealpha", 0);
 for t = 0:45:359;
   text (25, 25, 0, "Vertical Alignment = Bottom", ...
                    "rotation", t, ...
                    "horizontalalignment", "left", ...
                    "verticalalignment", "bottom");
 endfor
 caxis ([-100 100]);
 title ("Vertically Aligned at Bottom");
Produces the following figure
| Figure 1 |
|---|
 |
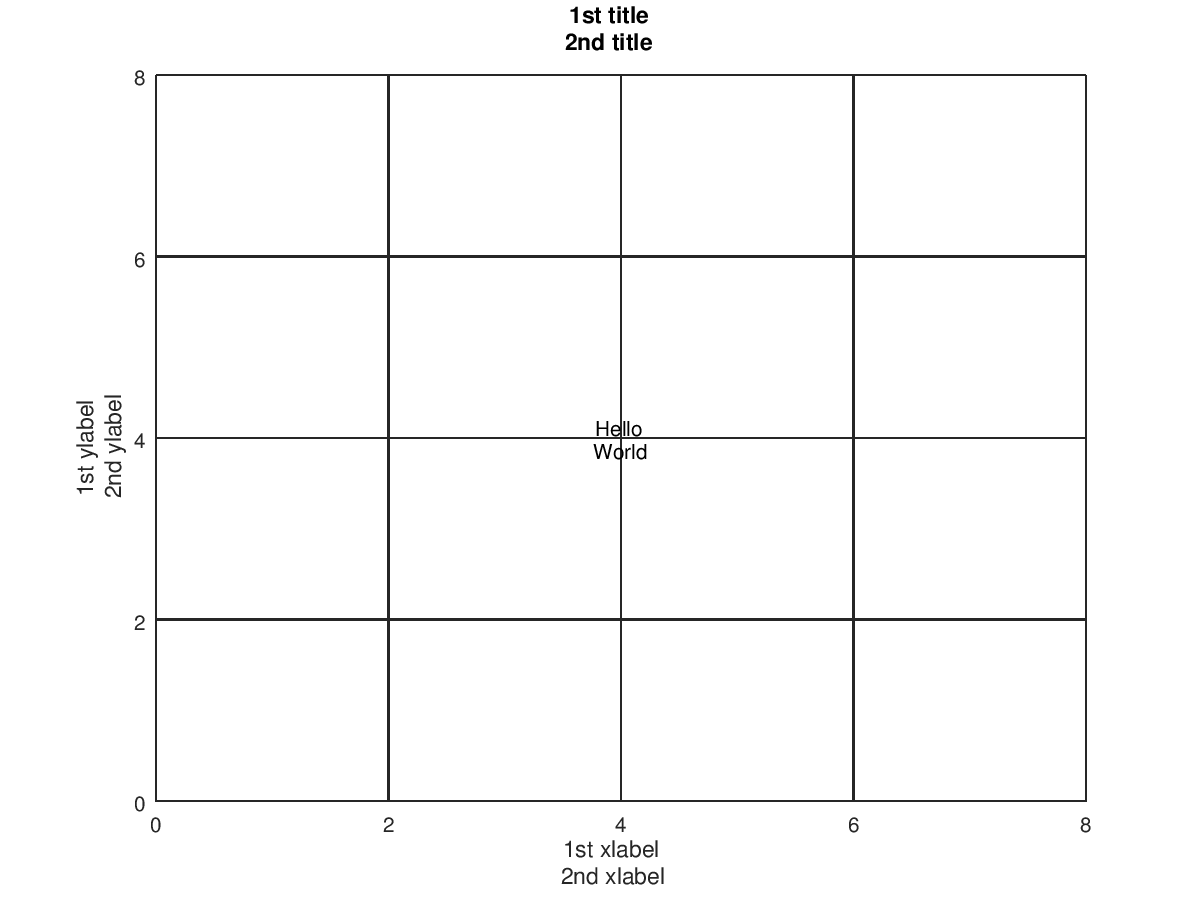
The following code
 clf;
 axis ([0 8 0 8]);
 title (["1st title";"2nd title"]);
 xlabel (["1st xlabel";"2nd xlabel"]);
 ylabel (["1st ylabel";"2nd ylabel"]);
 text (4, 4, {"Hello", "World"}, ...
       "horizontalalignment", "center", ...
       "verticalalignment", "middle");
 grid on;
Produces the following figure
| Figure 1 |
|---|
 |
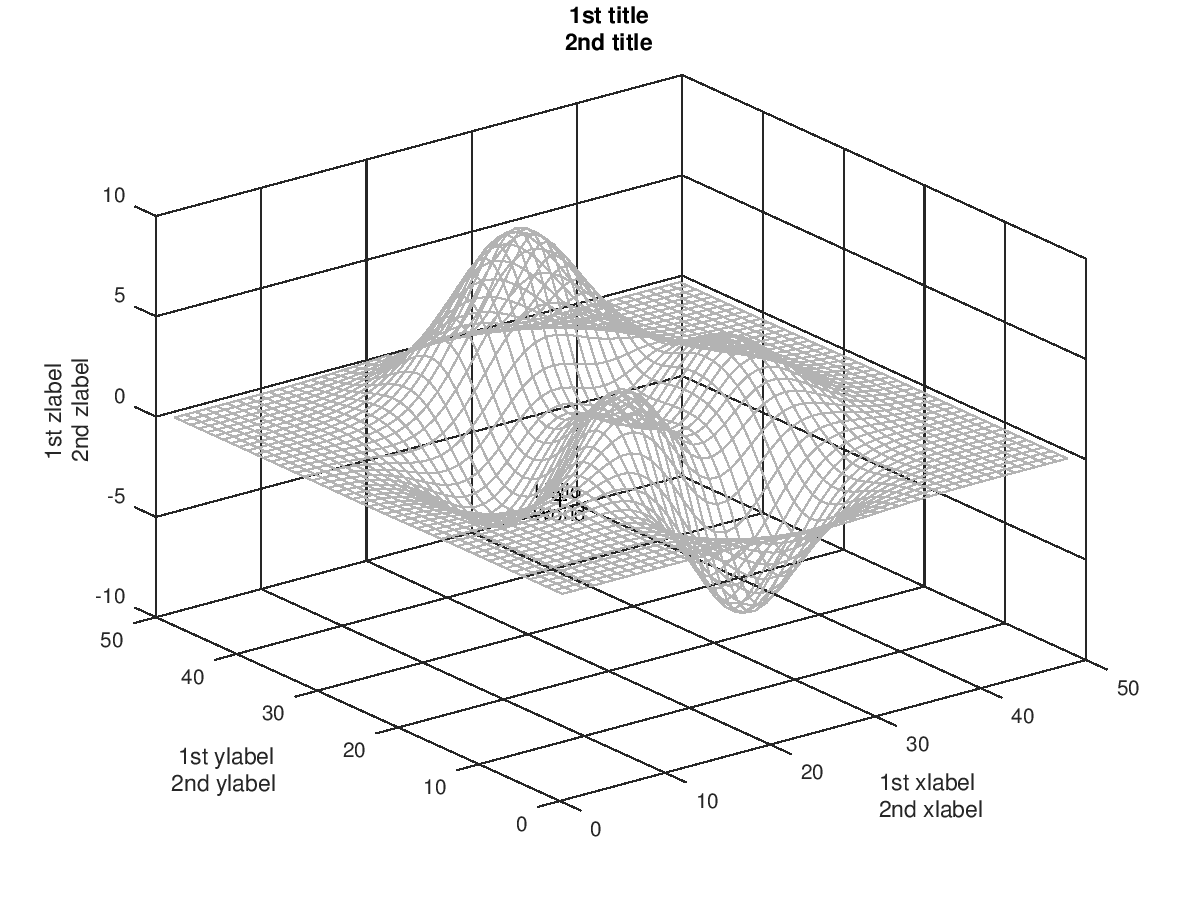
The following code
 clf;
 h = mesh (peaks (), "edgecolor", 0.7 * [1 1 1], ...
                     "facecolor", "none", ...
                     "facealpha", 0);
 title (["1st title";"2nd title"]);
 xlabel (["1st xlabel";"2nd xlabel"]);
 ylabel (["1st ylabel";"2nd ylabel"]);
 zlabel (["1st zlabel";"2nd zlabel"]);
 text (0, 0, 5, {"Hello", "World"}, ...
       "horizontalalignment", "center", ...
       "verticalalignment", "middle");
 hold on;
 plot3 (0, 0, 5, "+k");
Produces the following figure
| Figure 1 |
|---|
 |
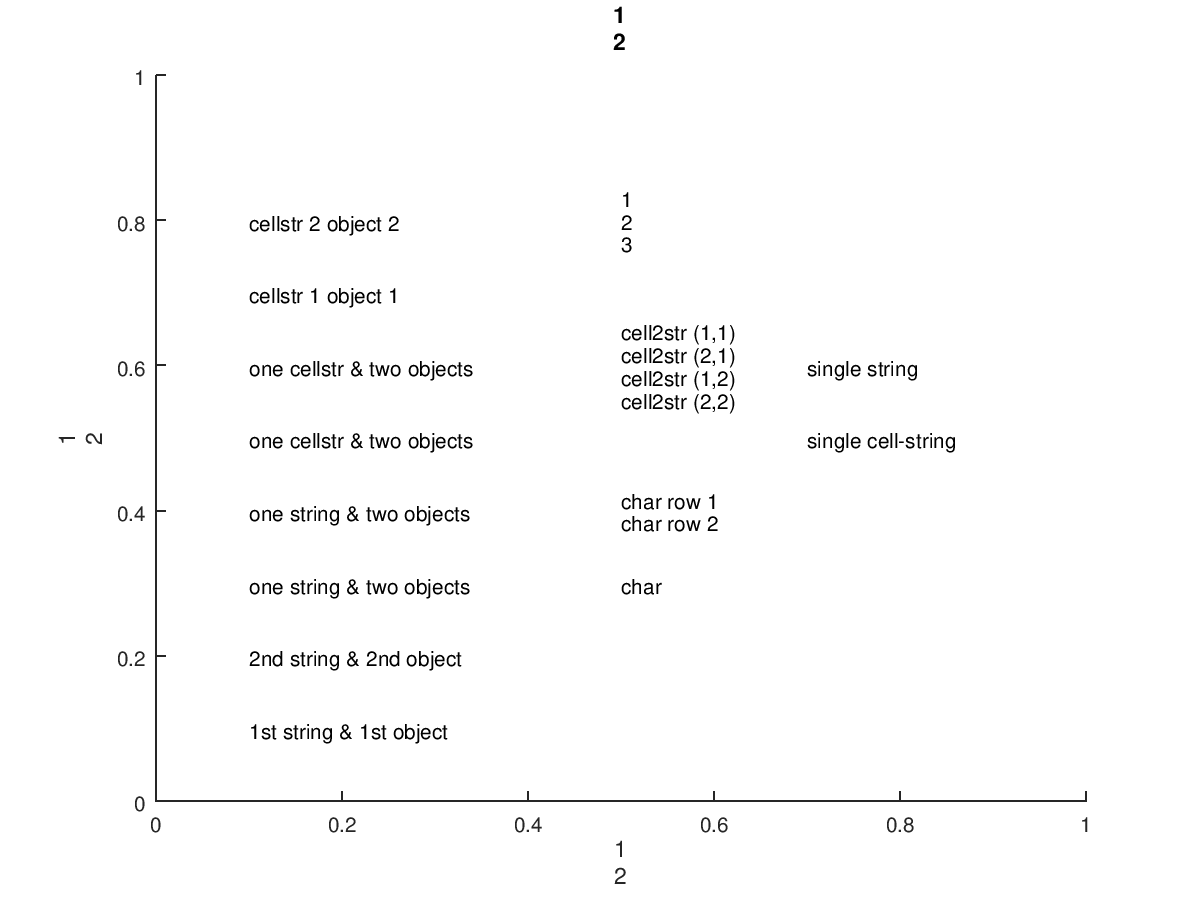
The following code
 clf;
 h = text (0.5, 0.3, "char");
 h = text (0.5, 0.4, ["char row 1"; "char row 2"]);
 h = text (0.5, 0.6, {"cell2str (1,1)", "cell2str (1,2)"; "cell2str (2,1)", "cell2str (2,2)"});
 h = text (0.5, 0.8, "foobar");
 set (h, "string", 1:3);
 h = text ([0.1, 0.1], [0.3, 0.4], "one string & two objects");
 h = text ([0.1, 0.1], [0.5, 0.6], {"one cellstr & two objects"});
 h = text ([0.1, 0.1], [0.7, 0.8], {"cellstr 1 object 1", "cellstr 2 object 2"});
 h = text ([0.1, 0.1], [0.1, 0.2], ["1st string & 1st object"; "2nd string & 2nd object"]);
 h = text (0.7, 0.6, "single string");
 h = text (0.7, 0.5, {"single cell-string"});
 xlabel (1:2);
 ylabel (1:2);
 title (1:2);
Produces the following figure
| Figure 1 |
|---|
 |
Package: octave