
|
Octave-Forge - Extra packages for GNU Octave |
| Home · Packages · Developers · Documentation · FAQ · Bugs · Mailing Lists · Links · Code |
|
|
Octave-Forge - Extra packages for GNU Octave |
| Home · Packages · Developers · Documentation · FAQ · Bugs · Mailing Lists · Links · Code |
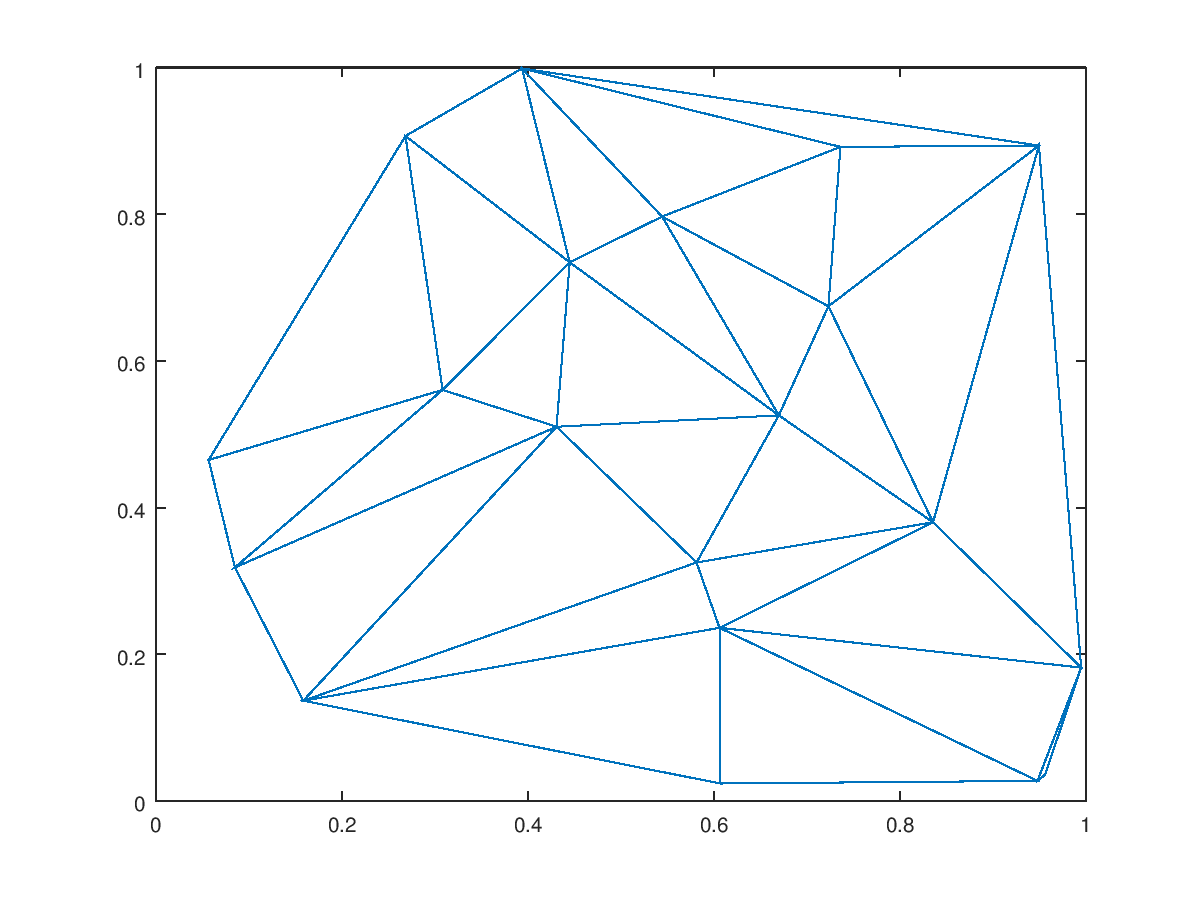
Plot a 2-D triangular mesh.
tri is typically the output of a Delaunay triangulation over the grid of x, y. Every row of tri represents one triangle and contains three indices into [x, y] which are the vertices of the triangles in the x-y plane.
The linestyle to use for the plot can be defined with the argument
linespec of the same format as the plot command.
The optional return value h is a graphics handle to the created patch object.
See also: plot, trimesh, trisurf, delaunay.
The following code
 clf;
 old_state = rand ("state");
 restore_state = onCleanup (@() rand ("state", old_state));
 rand ("state", 2);
 N = 20;
 x = rand (N, 1);
 y = rand (N, 1);
 tri = delaunay (x, y);
 triplot (tri, x, y);
Produces the following figure
| Figure 1 |
|---|
 |
Package: octave