
|
Octave-Forge - Extra packages for GNU Octave |
| Home · Packages · Developers · Documentation · FAQ · Bugs · Mailing Lists · Links · Code |
|
|
Octave-Forge - Extra packages for GNU Octave |
| Home · Packages · Developers · Documentation · FAQ · Bugs · Mailing Lists · Links · Code |
Plot a 3-D triangular surface.
In contrast to surf, which plots a surface mesh using rectangles,
trisurf plots the mesh using triangles.
tri is typically the output of a Delaunay triangulation over the grid of x, y. Every row of tri represents one triangle and contains three indices into [x, y] which are the vertices of the triangles in the x-y plane. z determines the height above the plane of each vertex.
The color of the trimesh is computed by linearly scaling the z values
to fit the range of the current colormap. Use caxis and/or
change the colormap to control the appearance.
Optionally, the color of the mesh can be specified independently of z by supplying a color matrix, c. If z has N elements, then c should be an Nx1 vector for colormap data or an Nx3 matrix for RGB data.
Any property/value pairs are passed directly to the underlying patch object.
The optional return value h is a graphics handle to the created patch object.
See also: surf, triplot, trimesh, delaunay, patch, shading.
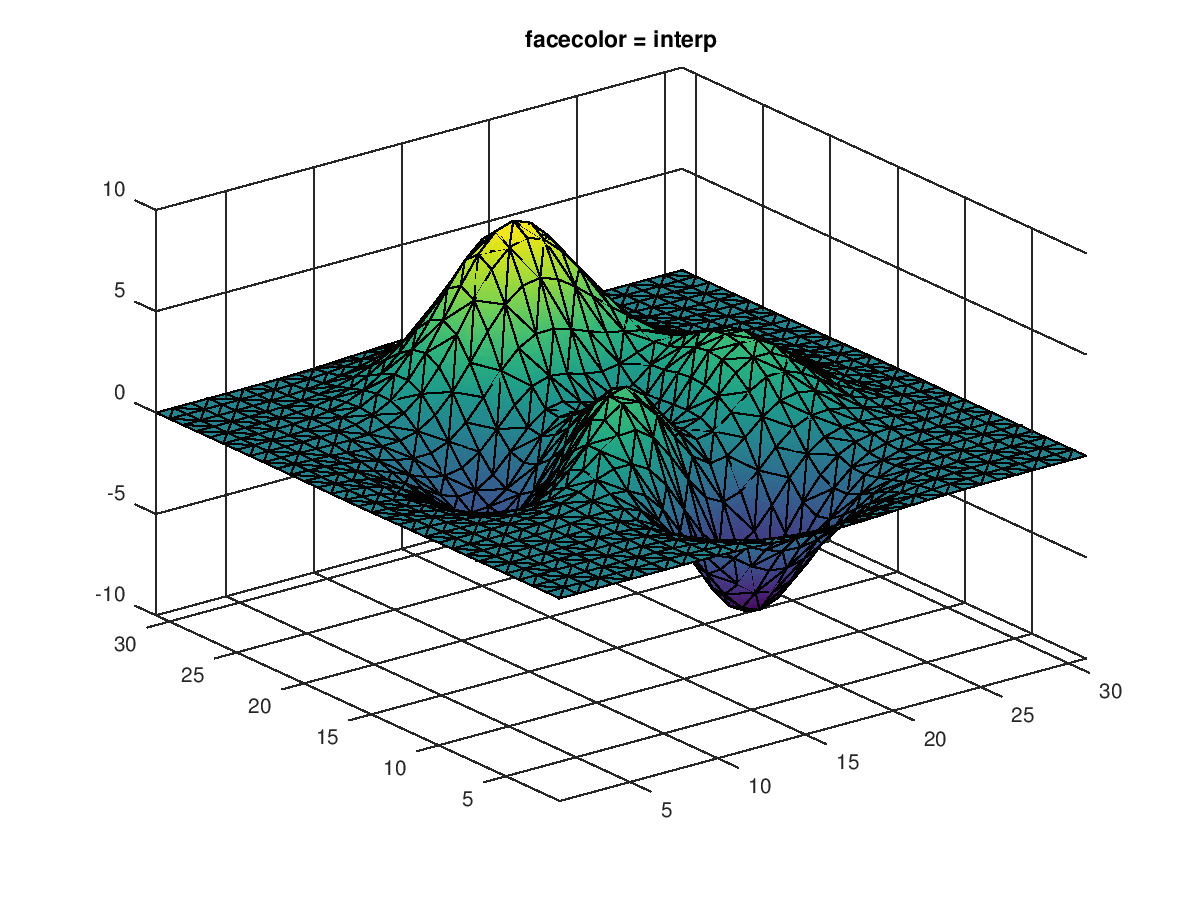
The following code
 clf;
 colormap ("default");
 N = 31;
 [x, y] = meshgrid (1:N);
 tri = delaunay (x(:), y(:));
 z = peaks (N);
 h = trisurf (tri, x, y, z, "facecolor", "interp");
 axis tight;
 zlim auto;
 title (sprintf ("facecolor = %s", get (h, "facecolor")));
Produces the following figure
| Figure 1 |
|---|
 |
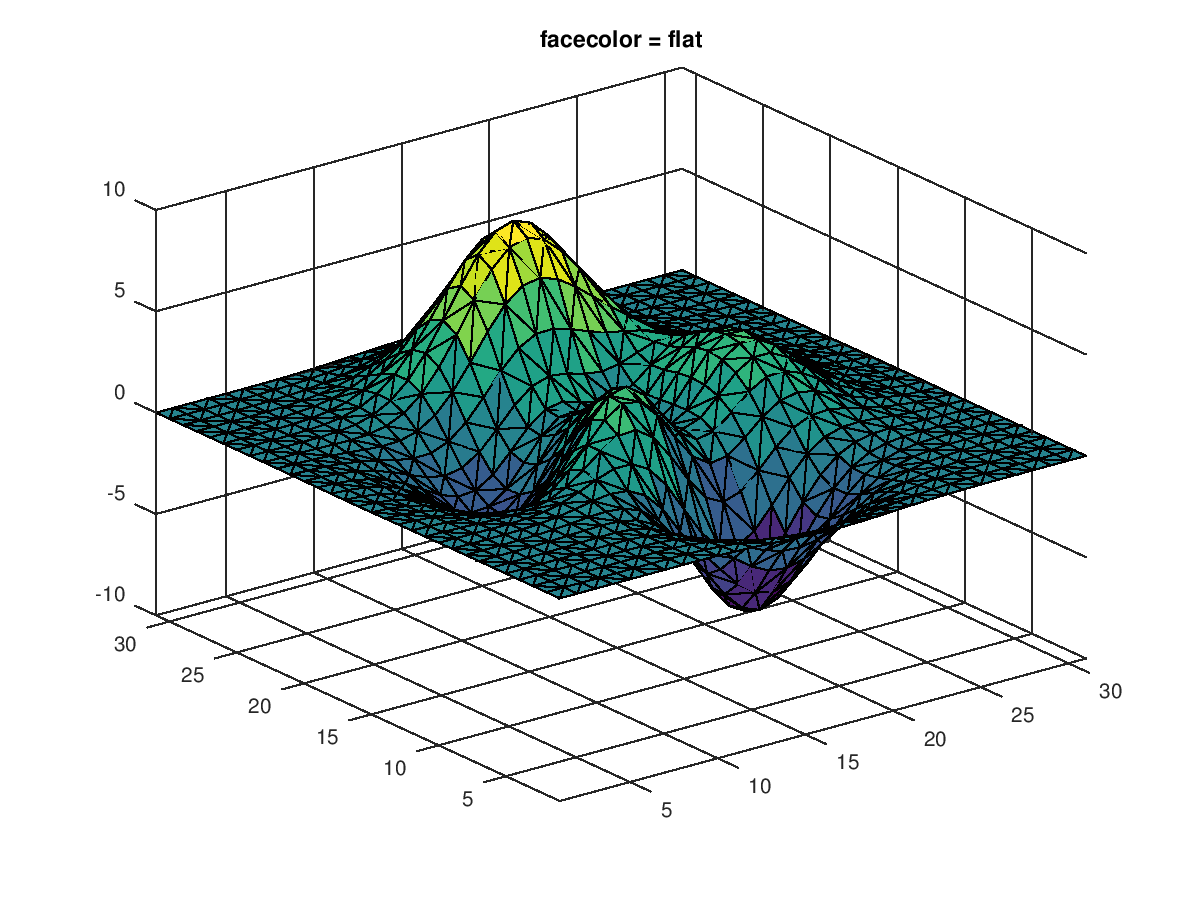
The following code
 clf;
 colormap ("default");
 N = 31;
 [x, y] = meshgrid (1:N);
 tri = delaunay (x(:), y(:));
 z = peaks (N);
 h = trisurf (tri, x, y, z, "facecolor", "flat");
 axis tight;
 zlim auto;
 title (sprintf ("facecolor = %s", get (h, "facecolor")));
Produces the following figure
| Figure 1 |
|---|
 |
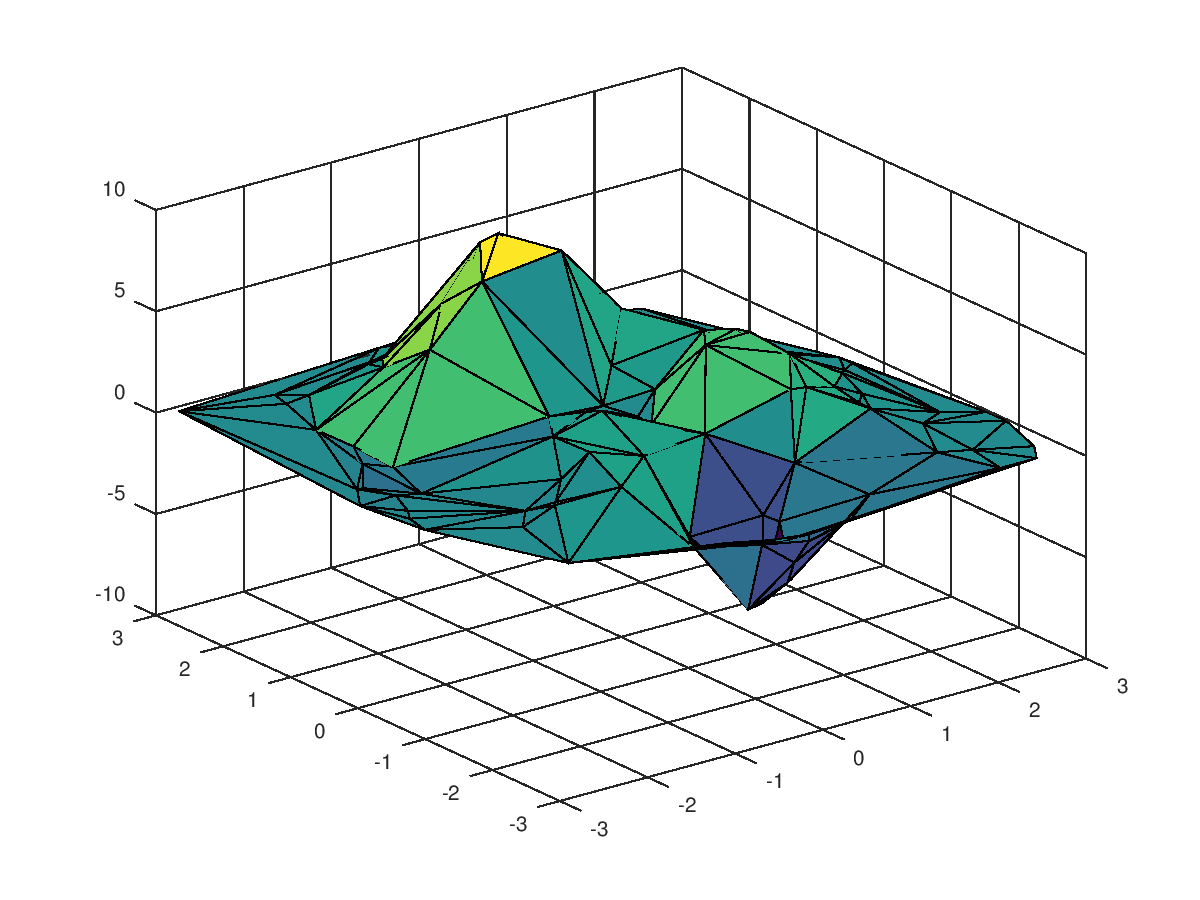
The following code
 clf;
 colormap ("default");
 old_state = rand ("state");
 restore_state = onCleanup (@() rand ("state", old_state));
 rand ("state", 10);
 N = 10;
 x = 3 - 6 * rand (N, N);
 y = 3 - 6 * rand (N, N);
 z = peaks (x, y);
 tri = delaunay (x(:), y(:));
 trisurf (tri, x(:), y(:), z(:));
Produces the following figure
| Figure 1 |
|---|
 |
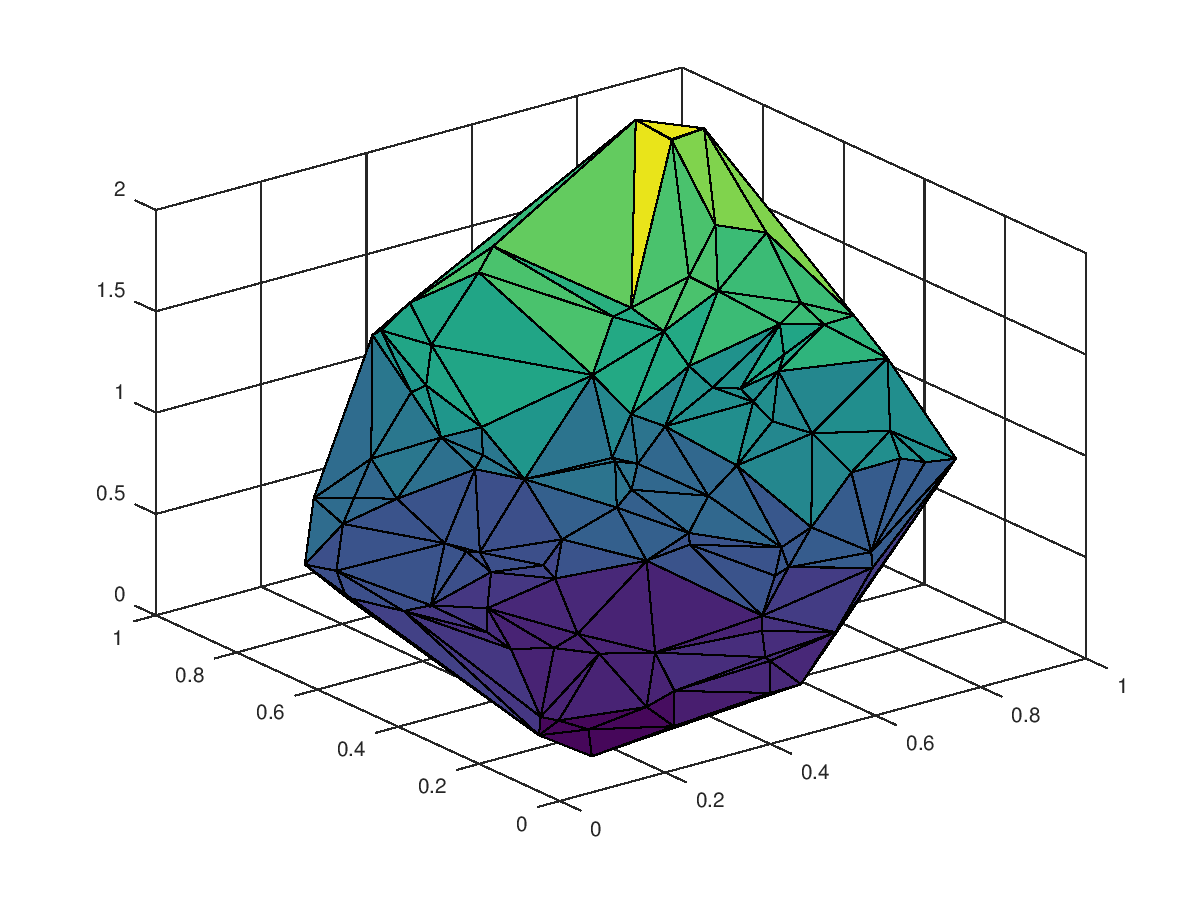
The following code
 clf;
 colormap ("default");
 x = rand (100, 1);
 y = rand (100, 1);
 z = x.^2 + y.^2;
 tri = delaunay (x, y);
 trisurf (tri, x, y, z);
Produces the following figure
| Figure 1 |
|---|
 |
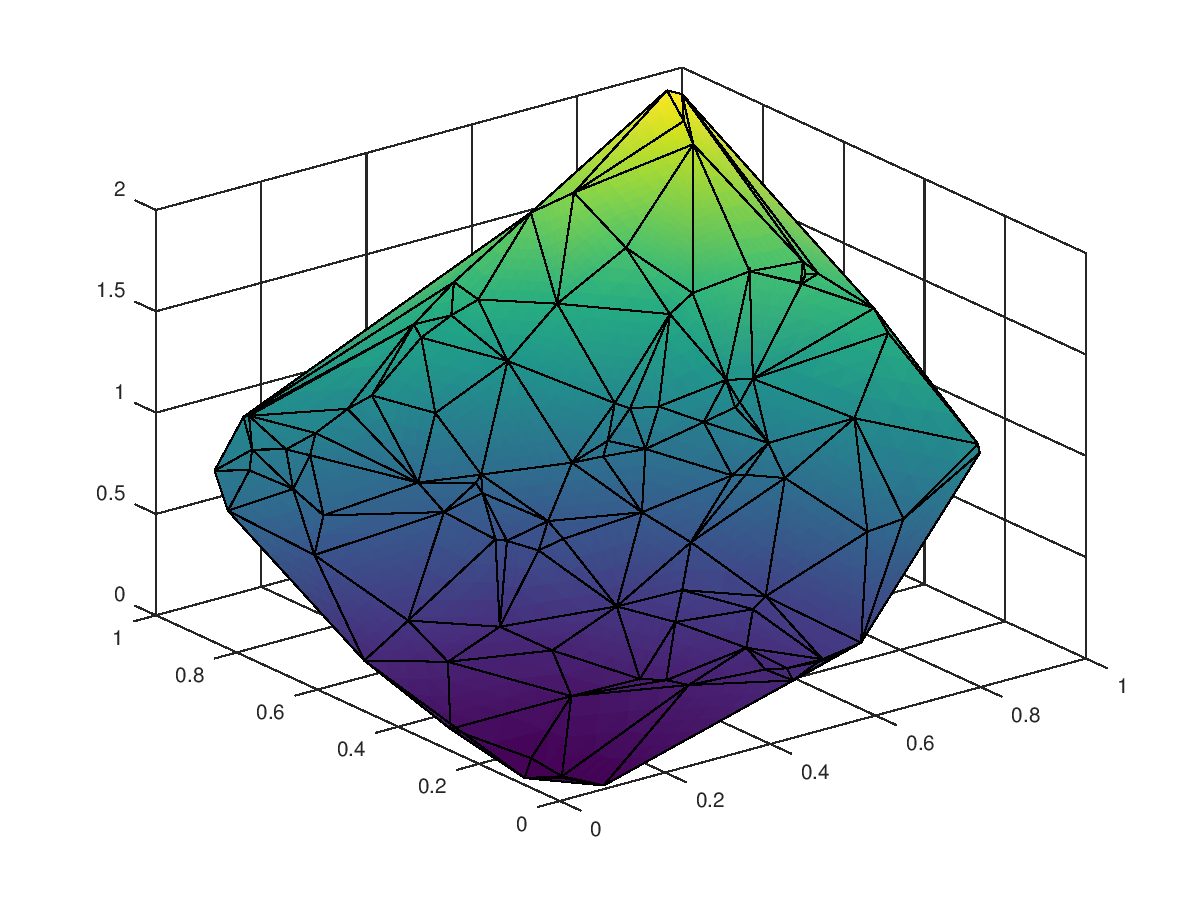
The following code
 clf;
 colormap ("default");
 x = rand (100, 1);
 y = rand (100, 1);
 z = x.^2 + y.^2;
 tri = delaunay (x, y);
 trisurf (tri, x, y, z, "facecolor", "interp");
Produces the following figure
| Figure 1 |
|---|
 |
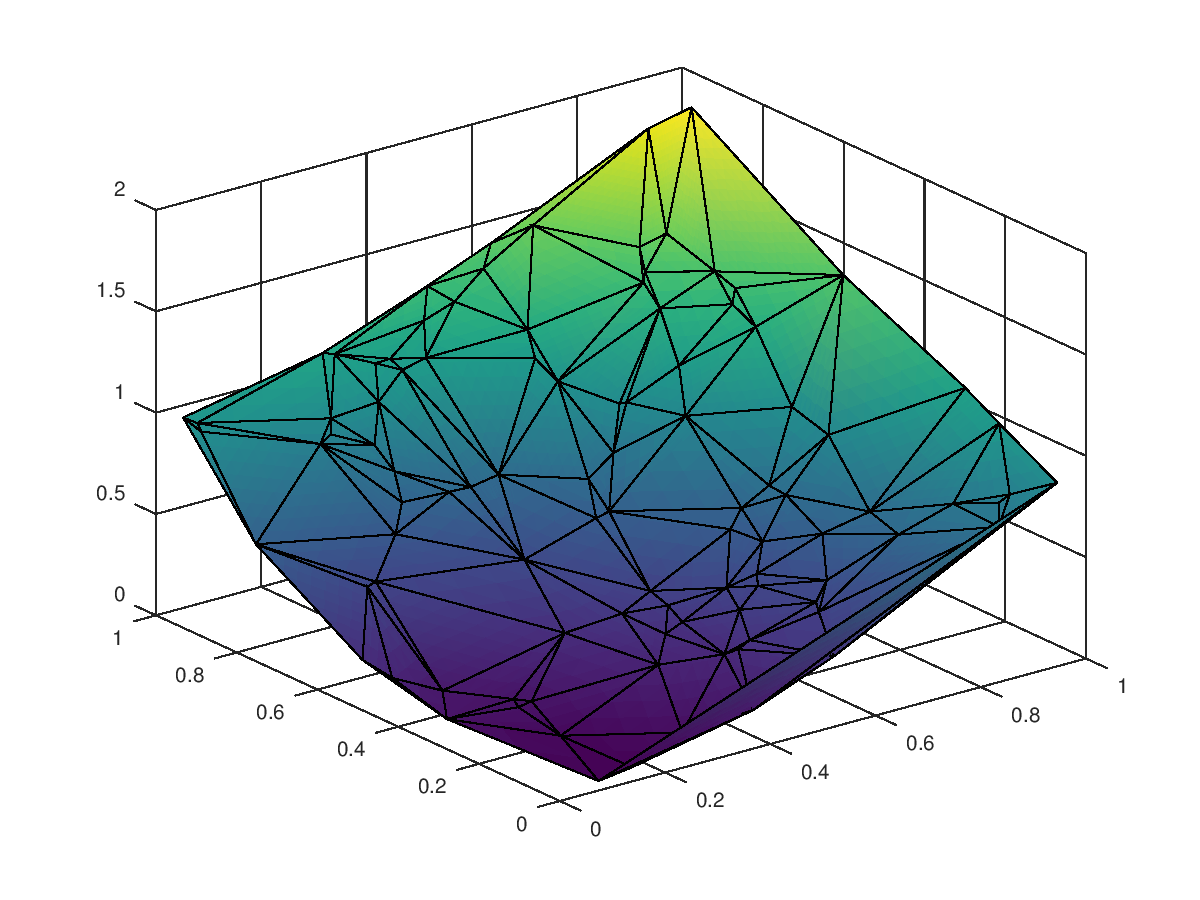
The following code
 clf;
 colormap ("default");
 x = rand (100, 1);
 y = rand (100, 1);
 z = x.^2 + y.^2;
 tri = delaunay (x, y);
 trisurf (tri, x, y, z, "facecolor", "interp", "edgecolor", "k");
Produces the following figure
| Figure 1 |
|---|
 |
Package: octave