- Function File: Z = zernike_cartesian (x, y, n)
- Function File: Z = zernike_cartesian (x, y, n, limit_r)
Return the cartesian zernikes up to order n (as noll’s index).
If limit_r is false (default true), the polynoms for r>1 are not set to NaN because strictly, the polynoms are only defined for 0 <= r <= 1.
Size of x must be equal size of y.
Demo: type "demo zernike_cartesian"
See also: zernike_name, zernike_noll_to_nm, zernike_polar, zernike_R_poly.
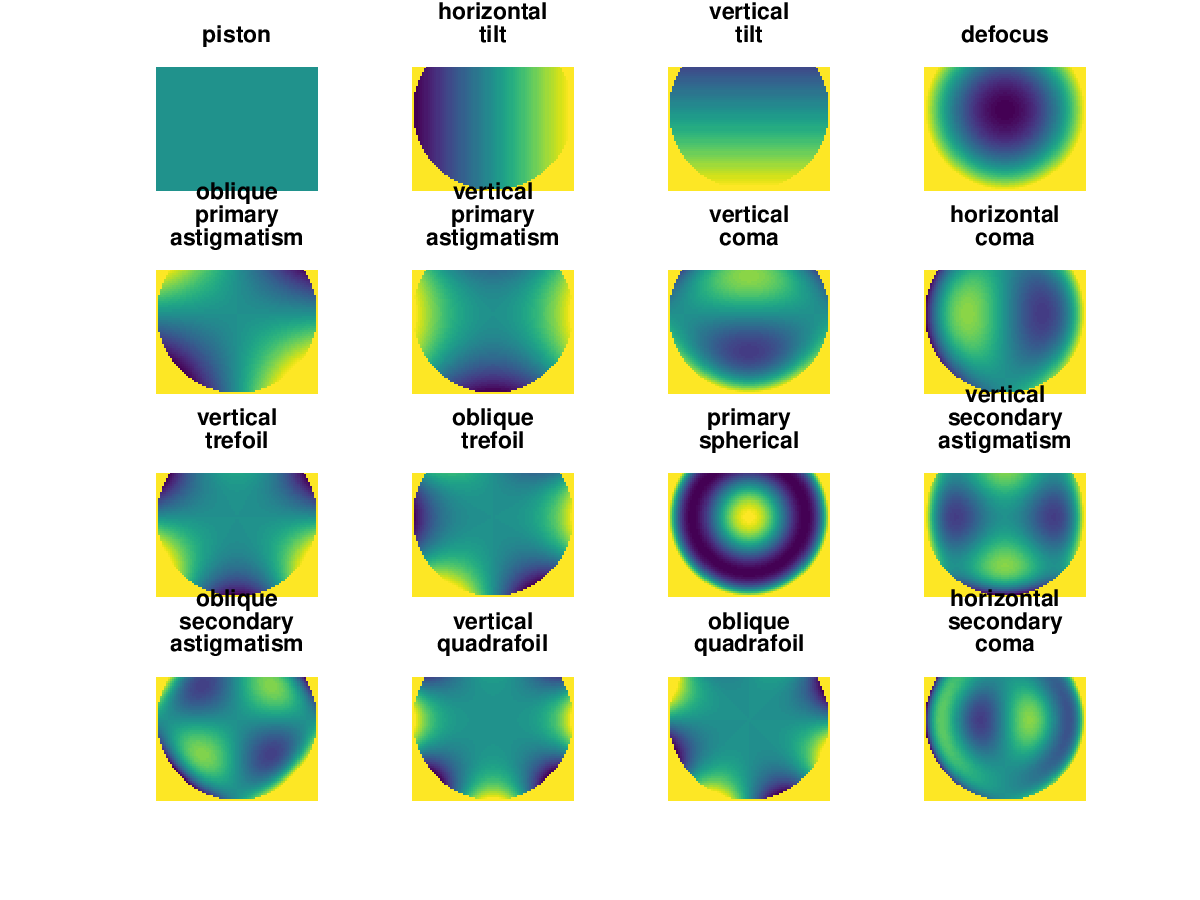
Demonstration 1
The following code
 t = linspace (-1, 1, 80);
 [x, y] = meshgrid (t, t);
 max_order = 16;
 Z = zernike_cartesian (x, y, max_order);
 for k = 1:max_order
   subplot (4, 4, k)
   factors = zeros (max_order, 1);
   factors(k) = 1;
   z = reshape (Z*factors, size (x));
   imagesc (z)
   axis ("off", "equal")
   zname = strrep (zernike_name (k), " ", "\n");
   title (zname)
 endfor
Produces the following figure
| Figure 1 |
|---|
 |
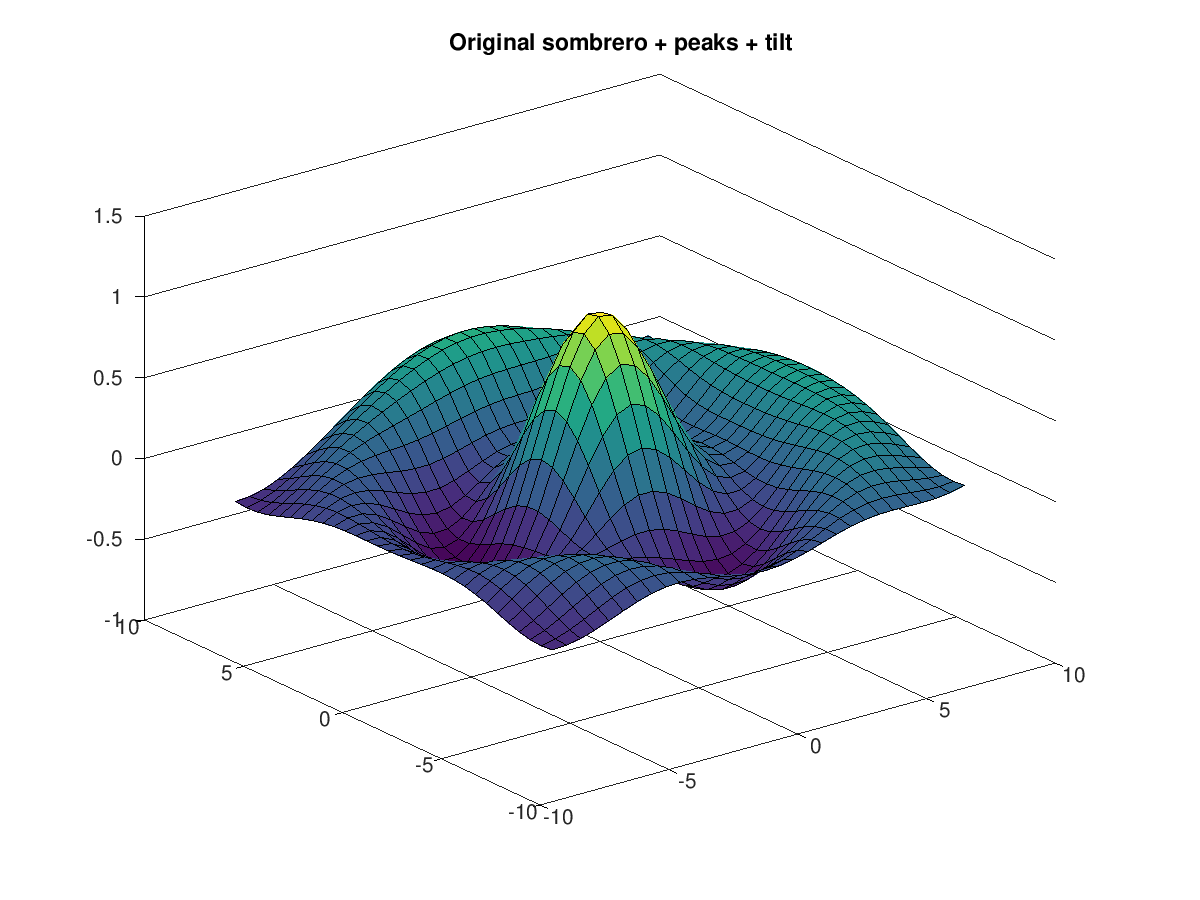
Demonstration 2
The following code
n=30;
[x,y,z] = sombrero (n);
z += 0.05 * peaks (x./4, y./4);
z += 0.02 * x;
figure
surf (x, y, z)
title ("Original sombrero + peaks + tilt");
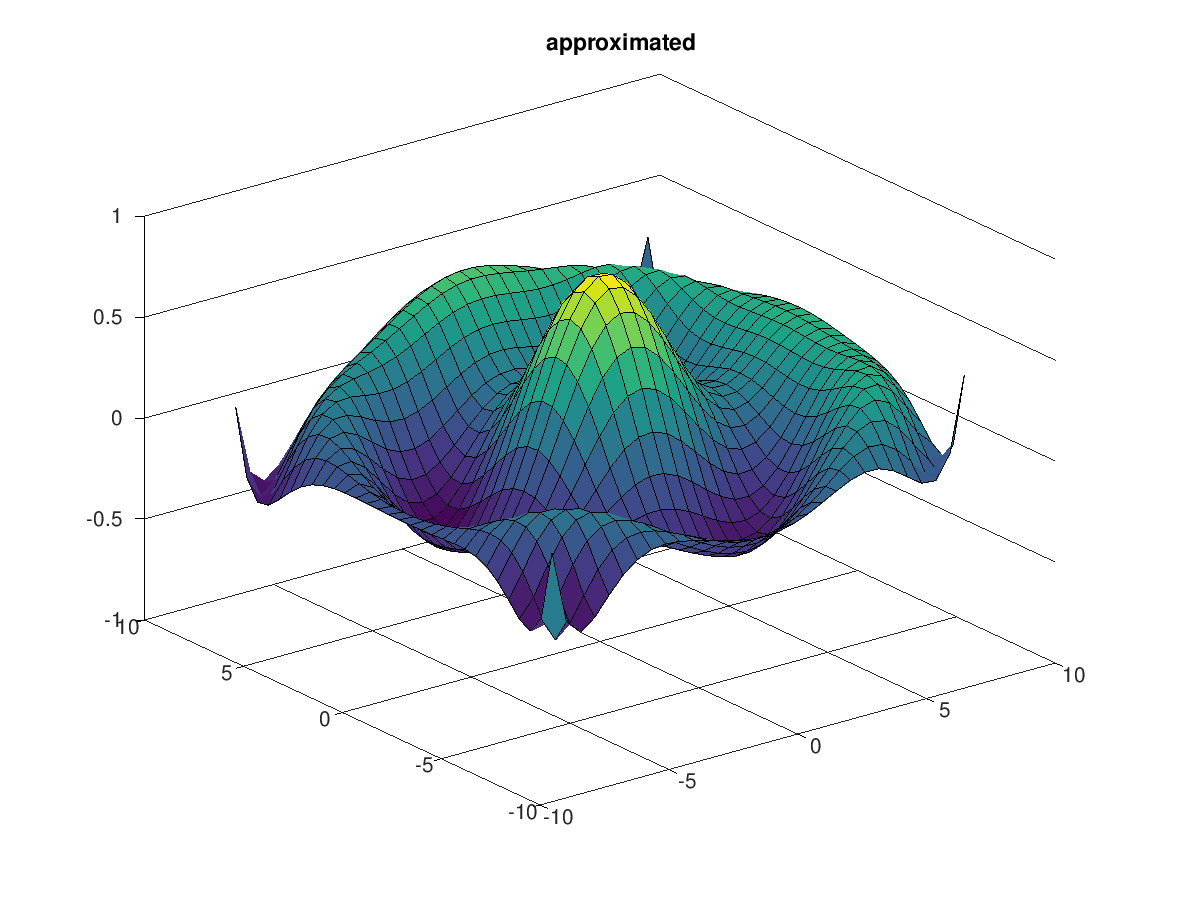
## approximate sombrero+peaks
d = 10;
x /= d;
y /= d;
max_order = 50;
Z = zernike_cartesian (x, y, max_order, false);
f = Z\z(:);
## create approximated plot
z_approx = reshape (Z * f, n, n);
figure
surf (10 * x, 10 * y, z_approx)
title ("approximated");
Produces the following figures
| Figure 1 | Figure 2 |
|---|---|
 |
 |
Package: optics