
|
Octave-Forge - Extra packages for GNU Octave |
| Home · Packages · Developers · Documentation · FAQ · Bugs · Mailing Lists · Links · Code |
|
|
Octave-Forge - Extra packages for GNU Octave |
| Home · Packages · Developers · Documentation · FAQ · Bugs · Mailing Lists · Links · Code |
Function File: gplot3 (a, xyz)
Function File: gplot3 (a, xyz, line_style)
Function File: [x, y, z] = gplot3 (a, xyz)
Plot a 3-dimensional graph defined by A and xyz in the graph theory sense. A is the adjacency matrix of the array to be plotted and xy is an n-by-3 matrix containing the coordinates of the nodes of the graph.
The optional parameter line_style defines the output style for the plot. Called with no output arguments the graph is plotted directly. Otherwise, return the coordinates of the plot in x and y.
The following code
## Define adjacency matrix of a graph with 5 nodes
A = [0, 1, 0, 0, 1;
1, 0, 1, 1, 1;
0, 1, 0, 1, 1;
0, 1, 1, 0, 1;
1, 1, 1, 1, 0 ];
## Define 3D points of the nodes
xyz = [2, 1, 3/2;
3, 2, 2;
8/3, 3, 1;
5/3, 3, 1;
1, 2, 2 ];
## Plot the 3D graph
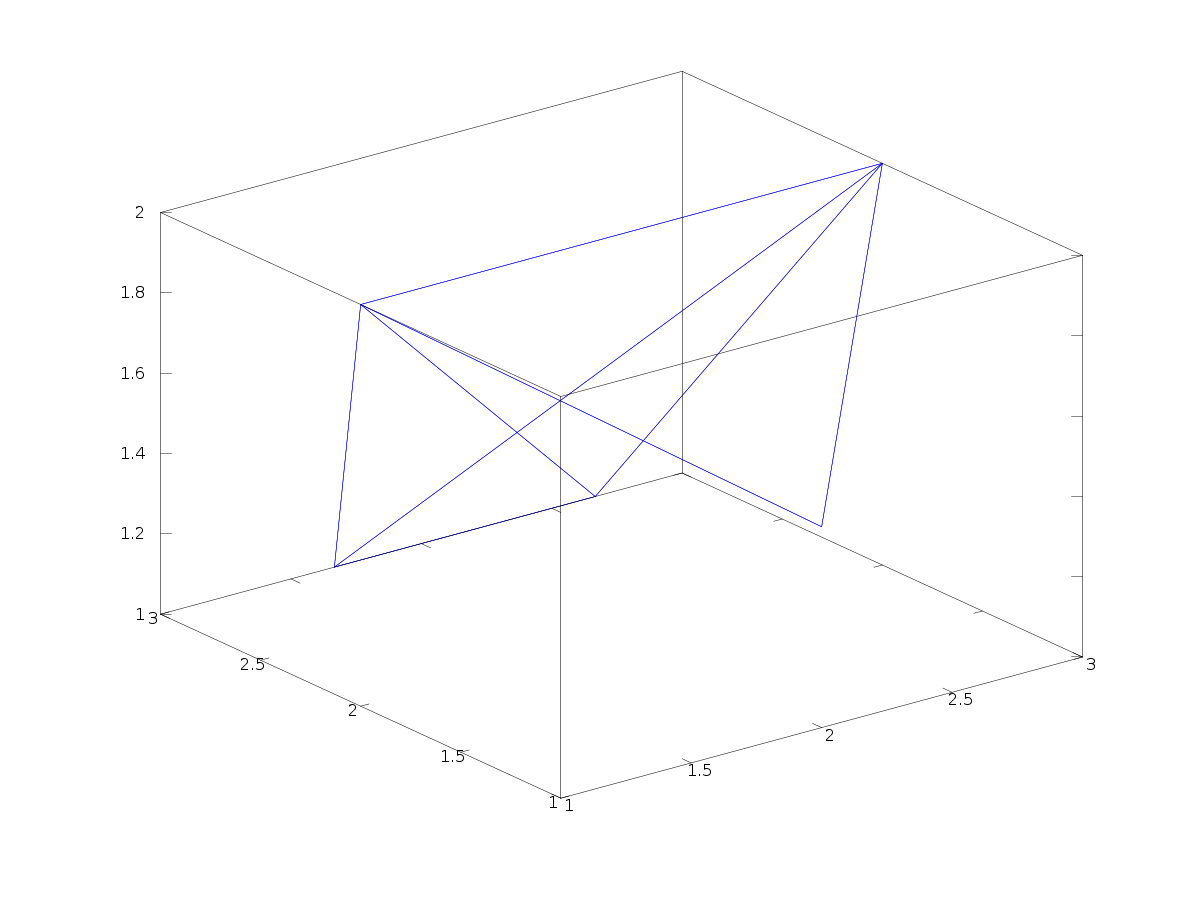
gplot3 (A, xyz);
Produces the following figure
| Figure 1 |
|---|
 |