- Function File: [U, R, Q, X] = qnclosed (N, S, V, …)
-
This function computes steady-state performance measures of closed queueing networks using the Mean Value Analysis (MVA) algorithm. The qneneing network is allowed to contain fixed-capacity centers, delay centers or general load-dependent centers. Multiple request classes are supported.
This function dispatches the computation to one of
qncsemva,qncsmvaldorqncmmva.- If N is a scalar, the network is assumed to have a single
class of requests; in this case, the exact MVA algorithm is used to
analyze the network. If S is a vector, then
S(k)is the average service time of center k, and this function callsqncsmvawhich supports load-independent service centers. If S is a matrix,S(k,i)is the average service time at center k when i=1, …, N jobs are present; in this case, the network is analyzed with theqncmmvaldfunction. - If N is a vector, the network is assumed to have multiple
classes of requests, and is analyzed using the exact multiclass
MVA algorithm as implemented in the
qncmmvafunction.
See also: qncsmva, qncsmvald, qncmmva.
- If N is a scalar, the network is assumed to have a single
class of requests; in this case, the exact MVA algorithm is used to
analyze the network. If S is a vector, then
Demonstration 1
The following code
P = [0 0.3 0.7; 1 0 0; 1 0 0]; # Transition probability matrix
S = [1 0.6 0.2]; # Average service times
m = ones(size(S)); # All centers are single-server
Z = 2; # External delay
N = 15; # Maximum population to consider
V = qncsvisits(P); # Compute number of visits
X_bsb_lower = X_bsb_upper = X_ab_lower = X_ab_upper = X_mva = zeros(1,N);
for n=1:N
[X_bsb_lower(n) X_bsb_upper(n)] = qncsbsb(n, S, V, m, Z);
[X_ab_lower(n) X_ab_upper(n)] = qncsaba(n, S, V, m, Z);
[U R Q X] = qnclosed( n, S, V, m, Z );
X_mva(n) = X(1)/V(1);
endfor
close all;
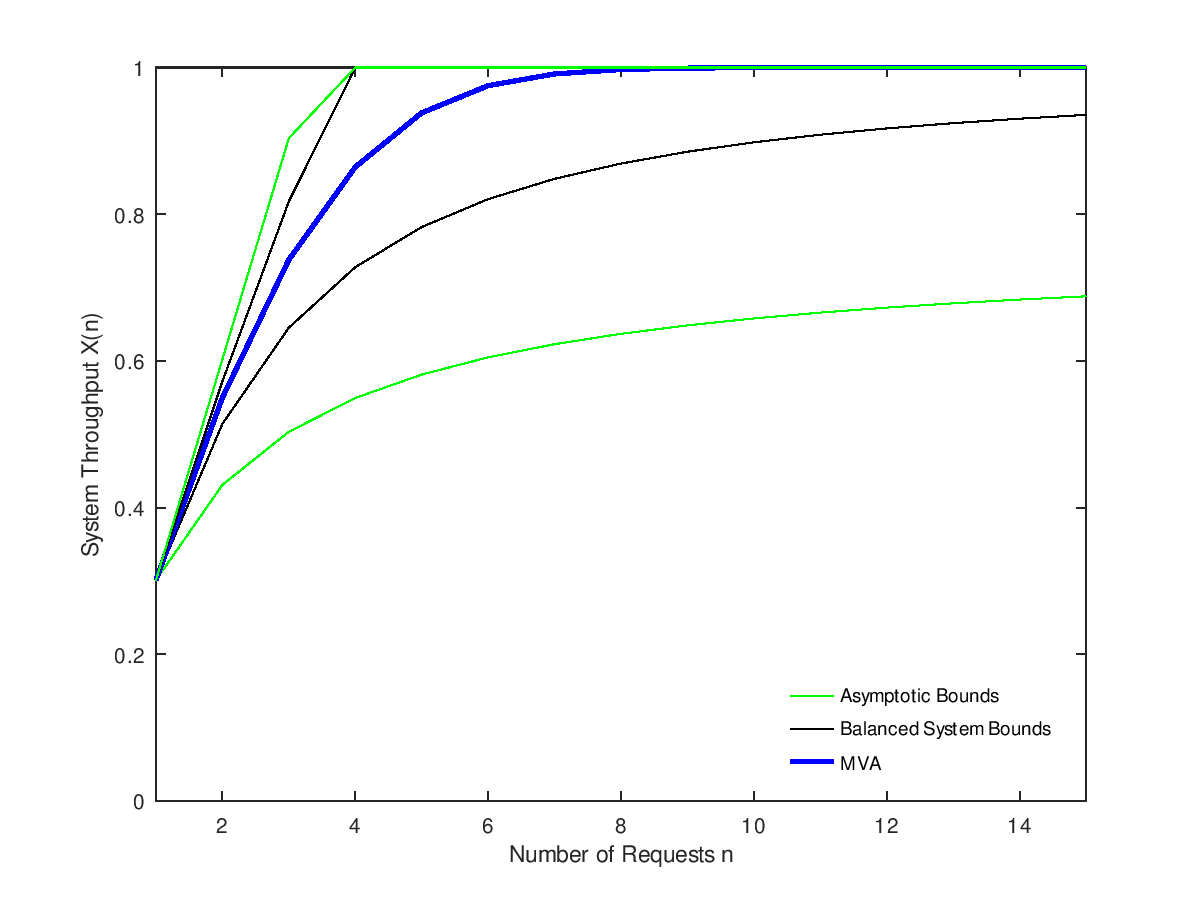
plot(1:N, X_ab_lower,"g;Asymptotic Bounds;", ...
1:N, X_bsb_lower,"k;Balanced System Bounds;", ...
1:N, X_mva,"b;MVA;", "linewidth", 2, ...
1:N, X_bsb_upper,"k", 1:N, X_ab_upper,"g" );
axis([1,N,0,1]); legend("location","southeast"); legend("boxoff");
xlabel("Number of Requests n"); ylabel("System Throughput X(n)");
Produces the following figure
| Figure 1 |
|---|
 |
Package: queueing