- Function File: [U, R, Q, X, p0, pm] = qsmmm (lambda, mu)
- Function File: [U, R, Q, X, p0, pm] = qsmmm (lambda, mu, m)
- Function File: pk = qsmmm (lambda, mu, m, k)
-
Compute utilization, response time, average number of requests in service and throughput for a M/M/m queue, a queueing system with m identical servers connected to a single FCFS queue.
INPUTS
lambdaArrival rate (
lambda>0).muService rate (
mu>lambda).mNumber of servers (
m ≥ 1). Default ism=1.kNumber of requests in the system (
k ≥ 0).
OUTPUTS
UService center utilization, U = \lambda / (m \mu).
RService center mean response time
QAverage number of requests in the system
XService center throughput. If the system is ergodic, we will always have
X = lambdap0Steady-state probability that there are 0 requests in the system
pmSteady-state probability that an arriving request has to wait in the queue
pkSteady-state probability that there are k requests in the system (including the one being served).
If this function is called with less than four parameters, lambda, mu and m can be vectors of the same size. In this case, the results will be vectors as well.
REFERENCES
- G. Bolch, S. Greiner, H. de Meer and K. Trivedi, Queueing Networks and Markov Chains: Modeling and Performance Evaluation with Computer Science Applications, Wiley, 1998, Section 6.5
See also: erlangc,qsmm1,qsmminf,qsmmmk.
Demonstration 1
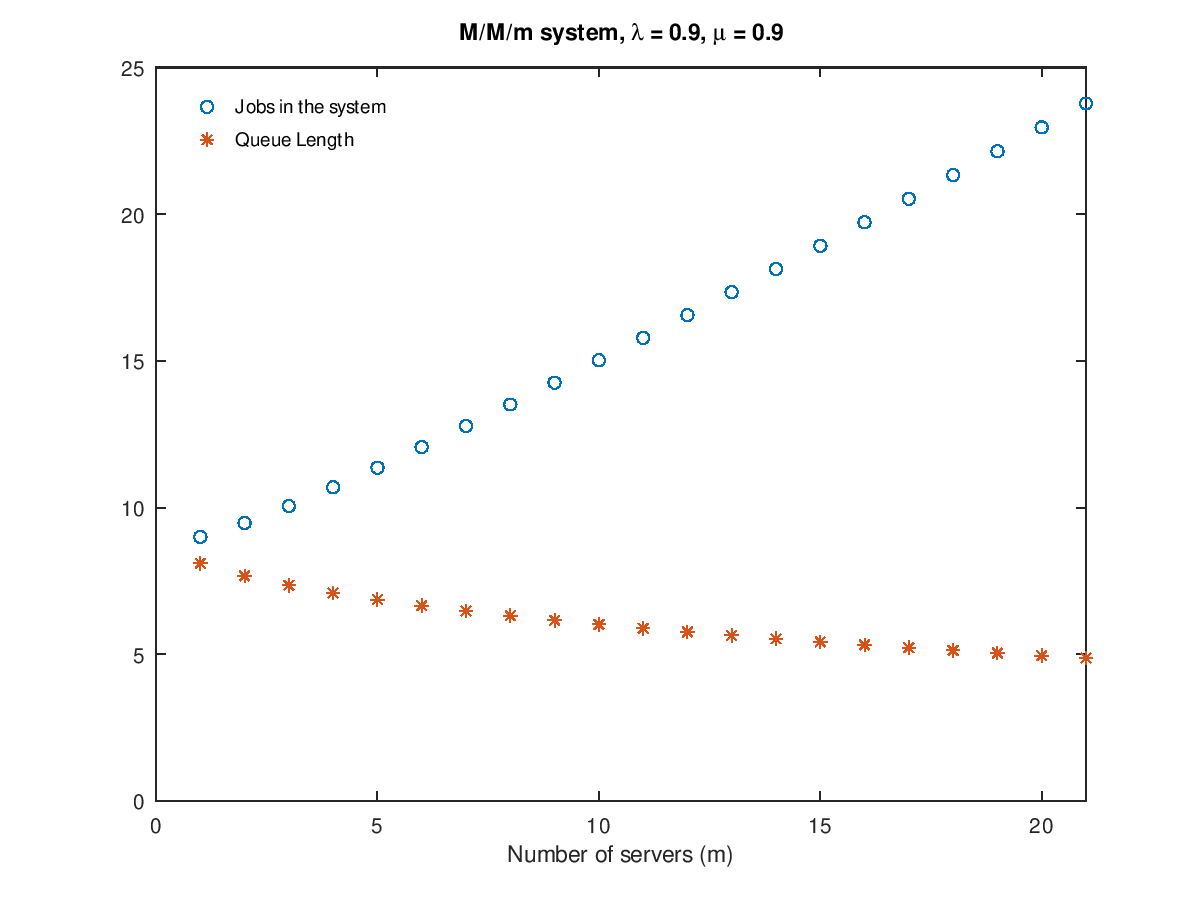
The following code
 # This is figure 6.4 on p. 220 Bolch et al.
 rho = 0.9;
 ntics = 21;
 lambda = 0.9;
 m = linspace(1,ntics,ntics);
 mu = lambda./(rho .* m);
 [U R Q X] = qsmmm(lambda, mu, m);
 qlen = X.*(R-1./mu);
 plot(m,Q,"o",qlen,"*");
 axis([0,ntics,0,25]);
 legend("Jobs in the system","Queue Length","location","northwest");
 legend("boxoff");
 xlabel("Number of servers (m)");
 title("M/M/m system, \\lambda = 0.9, \\mu = 0.9");
Produces the following figure
| Figure 1 |
|---|
 |
Demonstration 2
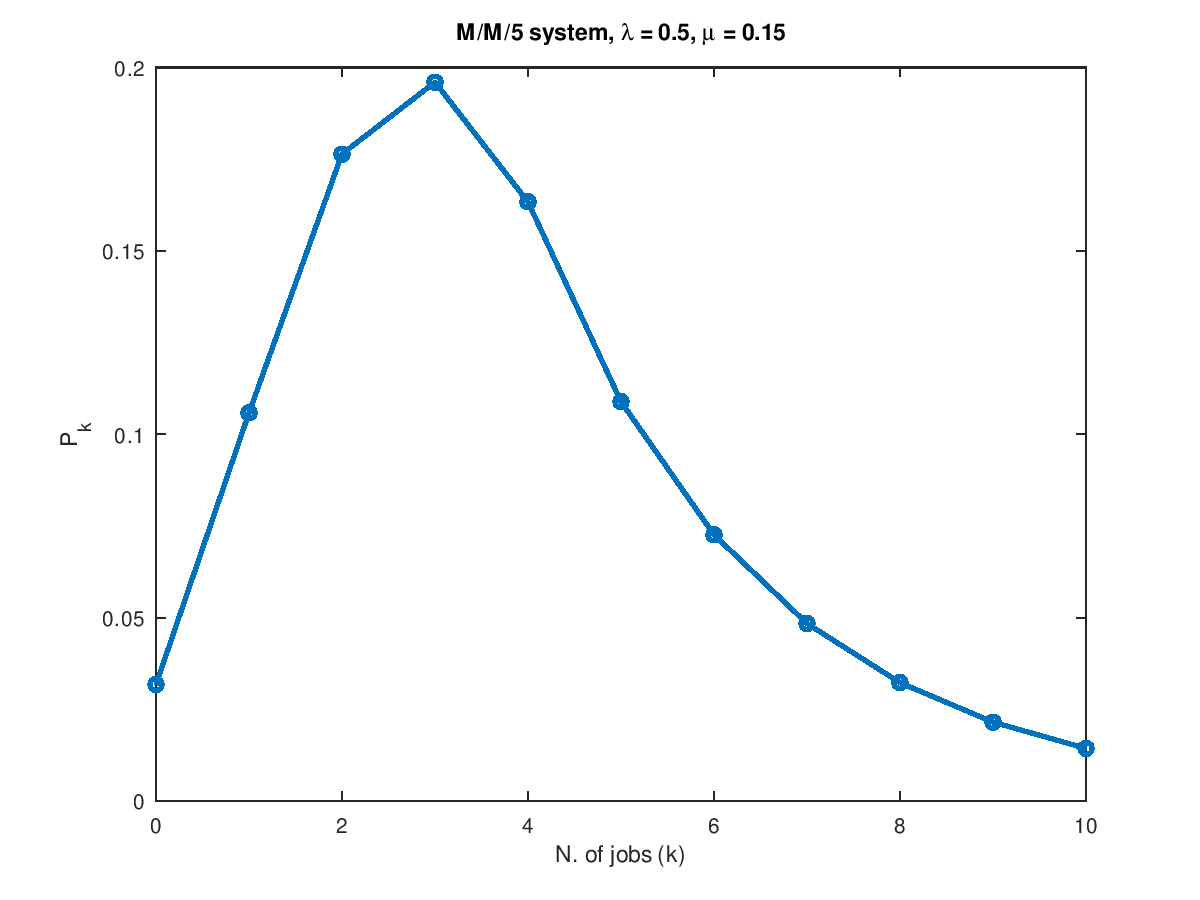
The following code
 ## Given a M/M/m queue, compute the steady-state probability pk of
 ## having k jobs in the systen.
 lambda = 0.5;
 mu = 0.15;
 m = 5;
 k = 0:10;
 pk = qsmmm(lambda, mu, m, k);
 plot(k, pk, "-o", "linewidth", 2);
 xlabel("N. of jobs (k)");
 ylabel("P_k");
 title(sprintf("M/M/%d system, \\lambda = %g, \\mu = %g", m, lambda, mu));
Produces the following figure
| Figure 1 |
|---|
 |
Package: queueing