- Function File:
n =cheb1ord(wp, ws, rp, rs)¶ - Function File:
n =cheb1ord([wp1, wp2], [ws1, ws2], rp, rs)¶ - Function File:
n =cheb1ord([wp1, wp2], [ws1, ws2], rp, rs, "s")¶ - Function File:
[n, wc] =cheb1ord(…)¶ - Function File:
[n, wc_p, wc_s] =cheb1ord(…)¶ Compute the minimum filter order of a Chebyshev type I filter with the desired response characteristics. The filter frequency band edges are specified by the passband frequency wp and stopband frequency ws. Frequencies are normalized to the Nyquist frequency in the range [0,1]. rp is the allowable passband ripple measured in decibels, and rs is the minimum attenuation in the stop band, also in decibels.
The output arguments n and wc_p (or n and wc_s) can be given as inputs to
cheby1. Using wc_p makes the filter characteristic touch at least one pass band corner and using wc_s makes the characteristic touch at least one stop band corner.If wp and ws are scalars, then wp is the passband cutoff frequency and ws is the stopband edge frequency. If ws is greater than wp, the filter is a low-pass filter. If wp is greater than ws, the filter is a high-pass filter.
If wp and ws are vectors of length 2, then wp defines the passband interval and ws defines the stopband interval. If wp is contained within ws (ws1 < wp1 < wp2 < ws2), the filter is a band-pass filter. If ws is contained within wp (wp1 < ws1 < ws2 < wp2), the filter is a band-stop or band-reject filter.
If the optional argument
"s"is given, the minimum order for an analog elliptic filter is computed. All frequencies wp and ws are specified in radians per second.See also: buttord, cheby1, cheb2ord, ellipord.
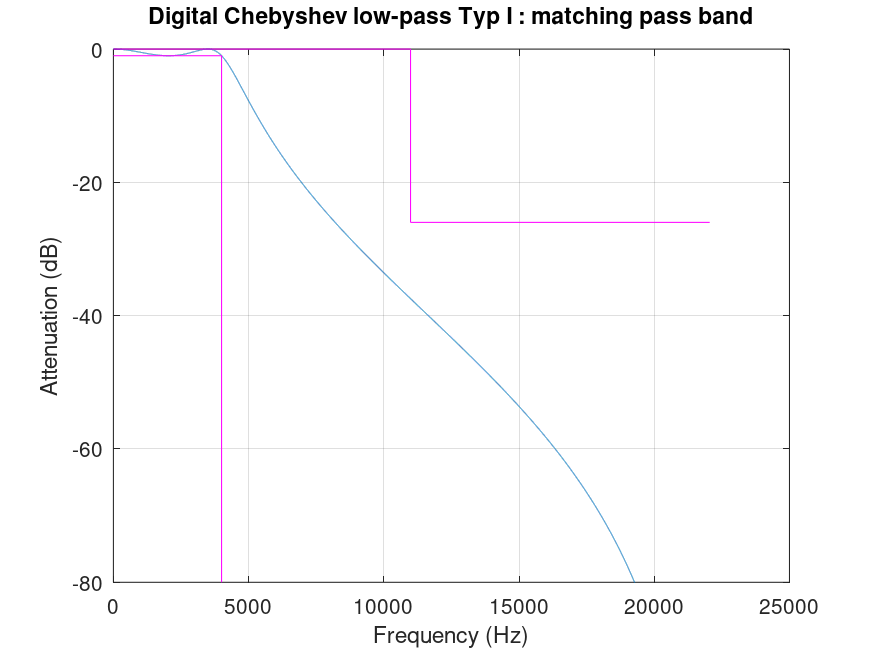
Demonstration 1
The following code
 fs    = 44100;
 fpass = 4000;
 fstop = 10988;
 Rpass = 1;
 Rstop = 26;
 Wpass = 2 / fs * fpass;
 Wstop = 2 / fs * fstop;
 [n, Wn_p, Wn_s] = cheb1ord (Wpass, Wstop, Rpass, Rstop)
 [b, a] = cheby1 (n, Rpass, Wn_p);
 SYS = tf (b, a, 1 / fs);
 f = (0:fs/2)';
 W = f * (2 * pi / fs);
 [H, P] = bode (SYS, 2 * pi * f);
 plot (f, 20 * log10 (abs (H)));
 title ("Digital Chebyshev low-pass Typ I : matching pass band");
 xlabel ("Frequency (Hz)");
 ylabel ("Attenuation (dB)");
 grid on;
 outline_lp_pass_x = [f(2)  , fpass(1), fpass(1)];
 outline_lp_pass_y = [-Rpass, -Rpass  , -80];
 outline_lp_stop_x = [f(2)  , fstop(1), fstop(1), max(f)];
 outline_lp_stop_y = [0     , 0       , -Rstop  , -Rstop];
 hold on;
 plot (outline_lp_pass_x, outline_lp_pass_y, "m");
 plot (outline_lp_stop_x, outline_lp_stop_y, "m");
 ylim ([-80, 0]);
Produces the following output
n = 3
Wn_p = 0.1814
Wn_s = 0.2644
and the following figure
| Figure 1 |
|---|
 |
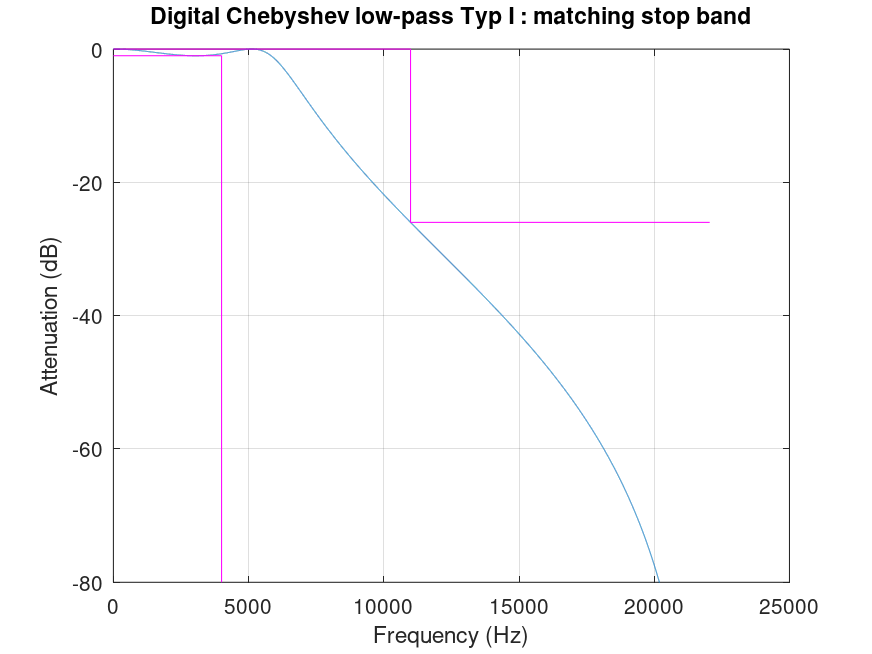
Demonstration 2
The following code
 fs    = 44100;
 fpass = 4000;
 fstop = 10988;
 Rpass = 1;
 Rstop = 26;
 Wpass = 2 / fs * fpass;
 Wstop = 2 / fs * fstop;
 [n, Wn_p, Wn_s] = cheb1ord (Wpass, Wstop, Rpass, Rstop)
 [b, a] = cheby1 (n, Rpass, Wn_s);
 SYS = tf (b, a, 1 / fs);
 f = (0:fs/2)';
 W = f * (2 * pi / fs);
 [H, P] = bode (SYS, 2 * pi * f);
 plot (f, 20 * log10 (abs (H)));
 title ("Digital Chebyshev low-pass Typ I : matching stop band");
 xlabel ("Frequency (Hz)");
 ylabel ("Attenuation (dB)");
 grid on;
 outline_lp_pass_x = [f(2)  , fpass(1), fpass(1)];
 outline_lp_pass_y = [-Rpass, -Rpass  , -80];
 outline_lp_stop_x = [f(2)  , fstop(1), fstop(1), max(f)];
 outline_lp_stop_y = [0     , 0       , -Rstop  , -Rstop];
 hold on;
 plot (outline_lp_pass_x, outline_lp_pass_y, "m");
 plot (outline_lp_stop_x, outline_lp_stop_y, "m");
 ylim ([-80, 0]);
Produces the following output
n = 3
Wn_p = 0.1814
Wn_s = 0.2644
and the following figure
| Figure 1 |
|---|
 |
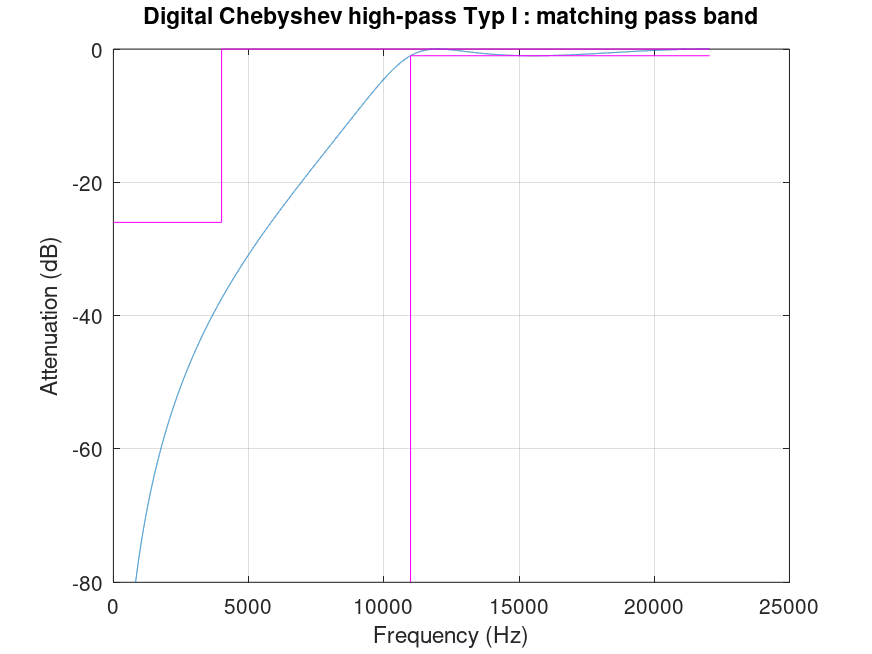
Demonstration 3
The following code
 fs    = 44100;
 fstop = 4000;
 fpass = 10988;
 Rpass = 1;
 Rstop = 26;
 Wpass = 2 / fs * fpass;
 Wstop = 2 / fs * fstop;
 [n, Wn_p, Wn_s] = cheb1ord (Wpass, Wstop, Rpass, Rstop)
 [b, a] = cheby1 (n, Rpass, Wn_p, "high");
 f = (0:fs/2)';
 W = f * (2 * pi / fs);
 H = freqz (b, a, W);
 plot (f, 20 * log10 (abs (H)));
 title ("Digital Chebyshev high-pass Typ I : matching pass band");
 xlabel ("Frequency (Hz)");
 ylabel ("Attenuation (dB)");
 grid on;
 outline_hp_pass_x = [fpass(1), fpass(1), max(f)];
 outline_hp_pass_y = [-80     , -Rpass  , -Rpass];
 outline_hp_stop_x = [min(f)  , fstop(1), fstop(1), max(f)];
 outline_hp_stop_y = [-Rstop  , -Rstop  , 0       , 0     ];
 hold on;
 plot (outline_hp_pass_x, outline_hp_pass_y, "m");
 plot (outline_hp_stop_x, outline_hp_stop_y, "m");
 ylim ([-80, 0]);
Produces the following output
n = 3
Wn_p = 0.4983
Wn_s = 0.3718
and the following figure
| Figure 1 |
|---|
 |
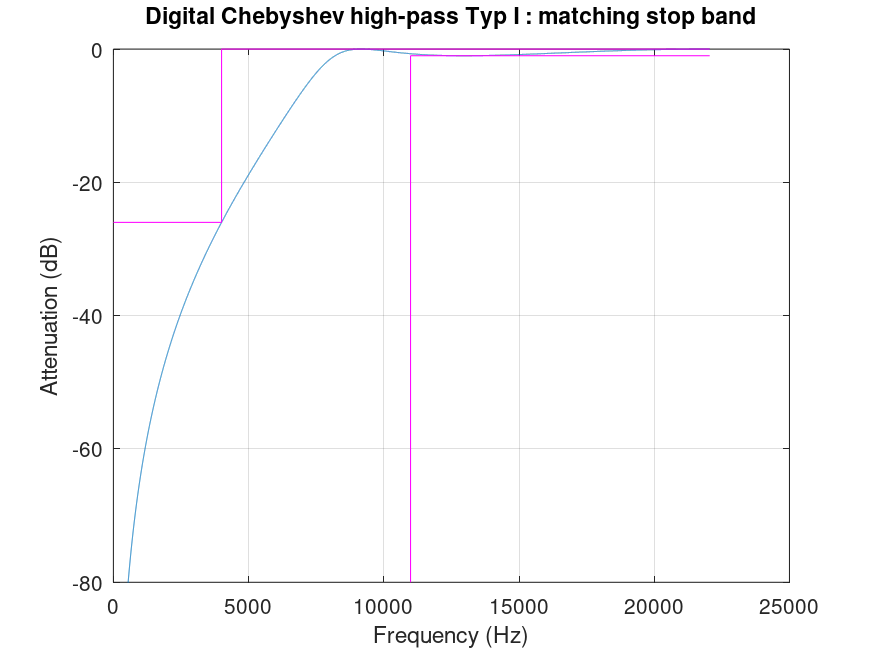
Demonstration 4
The following code
 fs    = 44100;
 fstop = 4000;
 fpass = 10988;
 Rpass = 1;
 Rstop = 26;
 Wpass = 2 / fs * fpass;
 Wstop = 2 / fs * fstop;
 [n, Wn_p, Wn_s] = cheb1ord (Wpass, Wstop, Rpass, Rstop)
 [b, a] = cheby1 (n, Rpass, Wn_s, "high");
 f = (0:fs/2)';
 W = f * (2 * pi / fs);
 H = freqz (b, a, W);
 plot (f, 20 * log10 (abs (H)));
 title ("Digital Chebyshev high-pass Typ I : matching stop band");
 xlabel ("Frequency (Hz)");
 ylabel ("Attenuation (dB)");
 grid on;
 outline_hp_pass_x = [fpass(1), fpass(1), max(f)];
 outline_hp_pass_y = [-80     , -Rpass  , -Rpass];
 outline_hp_stop_x = [min(f)  , fstop(1), fstop(1), max(f)];
 outline_hp_stop_y = [-Rstop  , -Rstop  , 0       , 0     ];
 hold on;
 plot (outline_hp_pass_x, outline_hp_pass_y, "m");
 plot (outline_hp_stop_x, outline_hp_stop_y, "m");
 ylim ([-80, 0]);
Produces the following output
n = 3
Wn_p = 0.4983
Wn_s = 0.3718
and the following figure
| Figure 1 |
|---|
 |
Demonstration 5
The following code
fs = 44100;
fpass = [9500 9750];
fstop = [8500, 10052];
Rpass = 1;
Rstop = 26;
Wpass = 2 / fs * fpass;
Wstop = 2 / fs * fstop;
[n, Wn_p, Wn_s] = cheb1ord (Wpass, Wstop, Rpass, Rstop)
[b, a] = cheby1 (n, Rpass, Wn_p);
f = (6000:14000)';
W = f * (2 * pi / fs);
H = freqz (b, a, W);
plot (f, 20 * log10 (abs (H)));
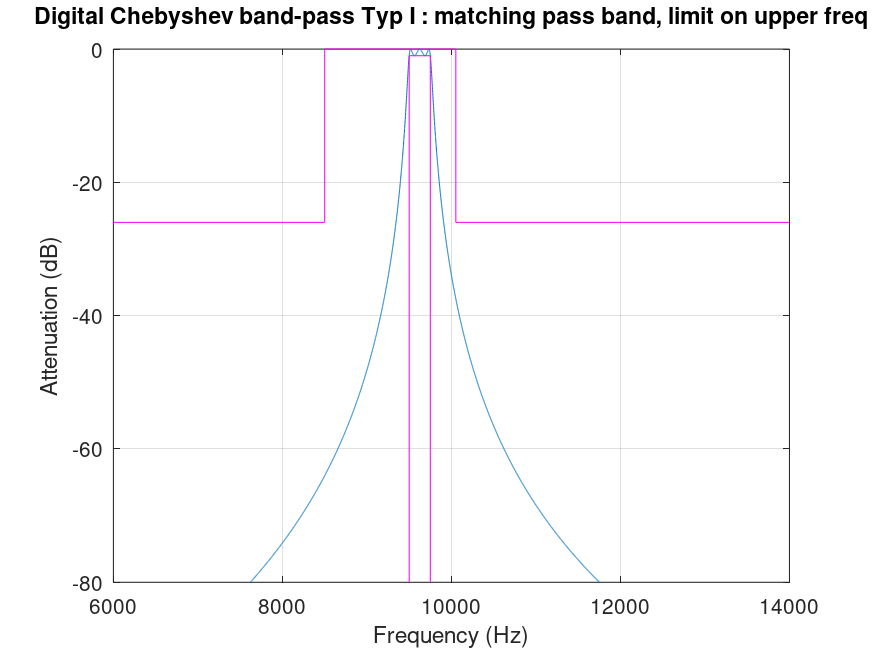
title ("Digital Chebyshev band-pass Typ I : matching pass band, limit on upper freq");
xlabel ("Frequency (Hz)");
ylabel ("Attenuation (dB)");
grid on;
outline_bp_pass_x = [fpass(1), fpass(1), fpass(2), fpass(2)];
outline_bp_pass_y = [-80 , -Rpass , -Rpass , -80];
outline_bp_stop_x = [min(f) , fstop(1), fstop(1), fstop(2), ...
fstop(2), max(f)];
outline_bp_stop_y = [-Rstop , -Rstop , 0 , 0 , ...
-Rstop , -Rstop];
hold on
plot (outline_bp_pass_x, outline_bp_pass_y, "m");
plot (outline_bp_stop_x, outline_bp_stop_y, "m");
grid on;
ylim ([-80, 0]);
Produces the following output
n = 3
Wn_p =

   0.4308   0.4422

Wn_s =

   0.4280   0.4451
and the following figure
| Figure 1 |
|---|
 |
Demonstration 6
The following code
fs = 44100;
fpass = [9500 9750];
fstop = [8500, 10052];
Rpass = 1;
Rstop = 26;
Wpass = 2 / fs * fpass;
Wstop = 2 / fs * fstop;
[n, Wn_p, Wn_s] = cheb1ord (Wpass, Wstop, Rpass, Rstop)
[b, a] = cheby1 (n, Rpass, Wn_s);
f = (6000:14000)';
W = f * (2 * pi / fs);
H = freqz (b, a, W);
plot (f, 20 * log10 (abs (H)));
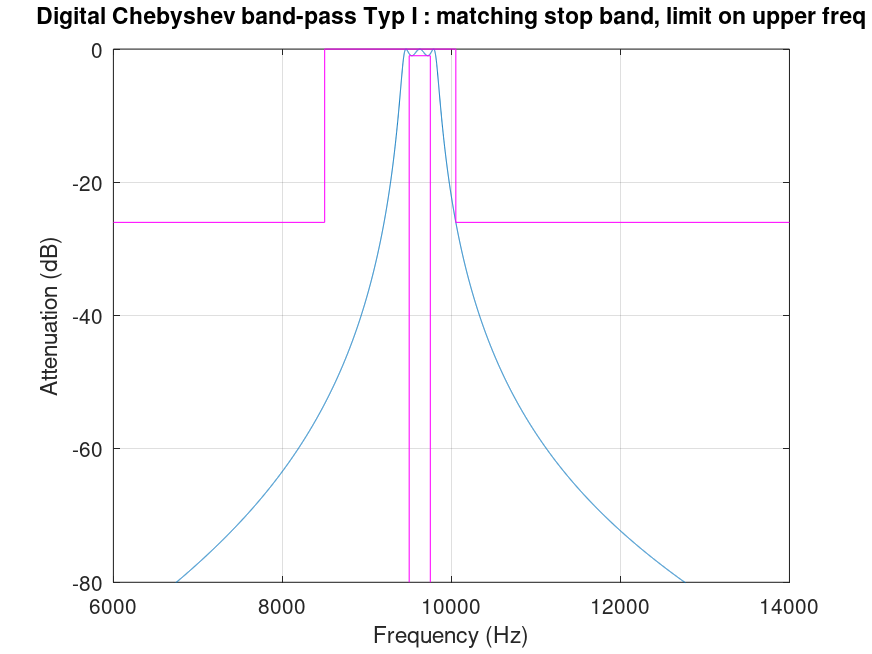
title ("Digital Chebyshev band-pass Typ I : matching stop band, limit on upper freq");
xlabel ("Frequency (Hz)");
ylabel ("Attenuation (dB)");
grid on;
outline_bp_pass_x = [fpass(1), fpass(1), fpass(2), fpass(2)];
outline_bp_pass_y = [-80 , -Rpass , -Rpass , -80];
outline_bp_stop_x = [min(f) , fstop(1), fstop(1), fstop(2), ...
fstop(2), max(f)];
outline_bp_stop_y = [-Rstop , -Rstop , 0 , 0 , ...
-Rstop , -Rstop];
hold on
plot (outline_bp_pass_x, outline_bp_pass_y, "m");
plot (outline_bp_stop_x, outline_bp_stop_y, "m");
grid on;
ylim ([-80, 0]);
Produces the following output
n = 3
Wn_p =

   0.4308   0.4422

Wn_s =

   0.4280   0.4451
and the following figure
| Figure 1 |
|---|
 |
Demonstration 7
The following code
fs = 44100;
fpass = [9500 9750];
fstop = [9182 12000];
Rpass = 1;
Rstop = 26;
Wpass = 2 / fs * fpass;
Wstop = 2 / fs * fstop;
[n, Wn_p, Wn_s] = cheb1ord (Wpass, Wstop, Rpass, Rstop)
[b, a] = cheby1 (n, Rpass, Wn_p);
f = (6000:14000)';
W = f * (2 * pi / fs);
H = freqz (b, a, W);
plot (f, 20 * log10 (abs (H)));
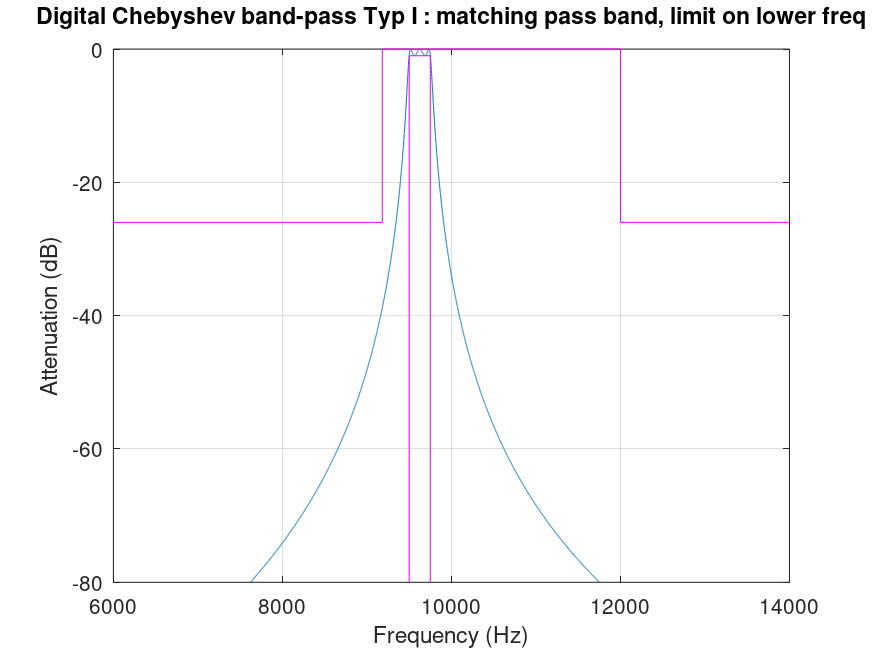
title ("Digital Chebyshev band-pass Typ I : matching pass band, limit on lower freq");
xlabel ("Frequency (Hz)");
ylabel ("Attenuation (dB)");
grid on;
outline_bp_pass_x = [fpass(1), fpass(1), fpass(2), fpass(2)];
outline_bp_pass_y = [-80 , -Rpass , -Rpass , -80];
outline_bp_stop_x = [min(f) , fstop(1), fstop(1), fstop(2), ...
fstop(2), max(f)];
outline_bp_stop_y = [-Rstop , -Rstop , 0 , 0 , ...
-Rstop , -Rstop];
hold on
plot (outline_bp_pass_x, outline_bp_pass_y, "m");
plot (outline_bp_stop_x, outline_bp_stop_y, "m");
grid on;
ylim ([-80, 0]);
Produces the following output
n = 3
Wn_p =

   0.4308   0.4422

Wn_s =

   0.4276   0.4455
and the following figure
| Figure 1 |
|---|
 |
Demonstration 8
The following code
fs = 44100;
fpass = [9500 9750];
fstop = [9182 12000];
Rpass = 1;
Rstop = 26;
Wpass = 2 / fs * fpass;
Wstop = 2 / fs * fstop;
[n, Wn_p, Wn_s] = cheb1ord (Wpass, Wstop, Rpass, Rstop)
[b, a] = cheby1 (n, Rpass, Wn_s);
f = (6000:14000)';
W = f * (2 * pi / fs);
H = freqz (b, a, W);
plot (f, 20 * log10 (abs (H)));
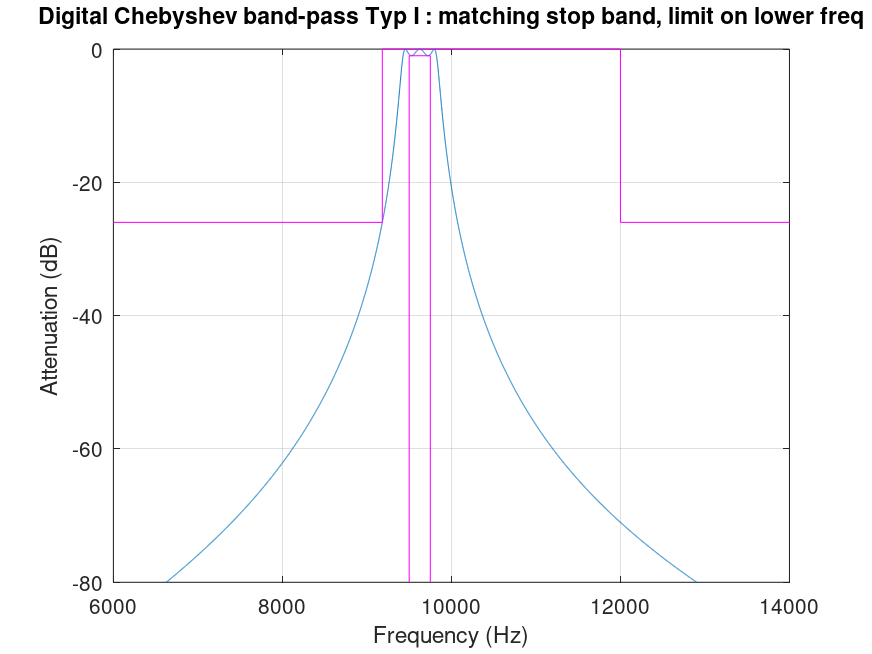
title ("Digital Chebyshev band-pass Typ I : matching stop band, limit on lower freq");
xlabel ("Frequency (Hz)");
ylabel ("Attenuation (dB)");
grid on;
outline_bp_pass_x = [fpass(1), fpass(1), fpass(2), fpass(2)];
outline_bp_pass_y = [-80 , -Rpass , -Rpass , -80];
outline_bp_stop_x = [min(f) , fstop(1), fstop(1), fstop(2), ...
fstop(2), max(f)];
outline_bp_stop_y = [-Rstop , -Rstop , 0 , 0 , ...
-Rstop , -Rstop];
hold on
plot (outline_bp_pass_x, outline_bp_pass_y, "m");
plot (outline_bp_stop_x, outline_bp_stop_y, "m");
grid on;
ylim ([-80, 0]);
Produces the following output
n = 3
Wn_p =

   0.4308   0.4422

Wn_s =

   0.4276   0.4455
and the following figure
| Figure 1 |
|---|
 |
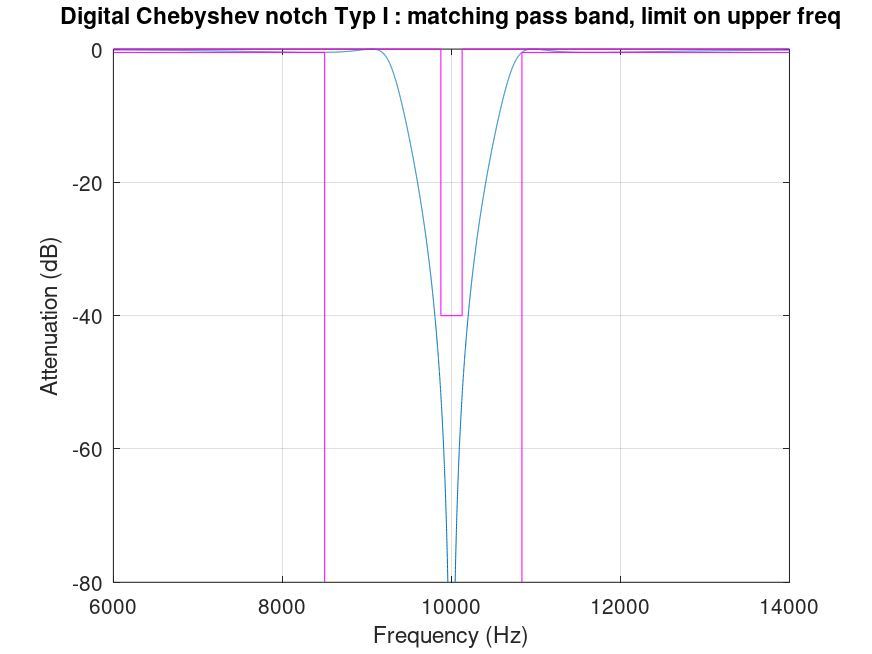
Demonstration 9
The following code
 fs    = 44100;
 fstop = [9875, 10126.5823];
 fpass = [8500, 10834];
 Rpass = 0.5;
 Rstop = 40;
 Wpass = 2 / fs * fpass;
 Wstop = 2 / fs * fstop;
 [n, Wn_p, Wn_s] = cheb1ord (Wpass, Wstop, Rpass, Rstop)
 [b, a] = cheby1 (n, Rpass, Wn_p, "stop");
 f = (6000:14000)';
 W = f * (2 * pi / fs);
 H = freqz (b, a, W);
 Ampl = abs (H);
 plot (f, 20 * log10 (abs (H)));
 title ("Digital Chebyshev notch Typ I : matching pass band, limit on upper freq");
 xlabel ("Frequency (Hz)");
 ylabel ("Attenuation (dB)");
 grid on;
 outline_notch_pass_x_a = [min(f)  , fpass(1), fpass(1)];
 outline_notch_pass_x_b = [fpass(2), fpass(2), max(f)];
 outline_notch_pass_y_a = [-Rpass  , -Rpass  , -80];
 outline_notch_pass_y_b = [-80     , -Rpass  , -Rpass];
 outline_notch_stop_x   = [min(f)  , fstop(1), fstop(1), fstop(2), ...
                                               fstop(2), max(f)];
 outline_notch_stop_y   = [0       , 0       , -Rstop  , -Rstop  , 0, 0 ];
 hold on;
 plot (outline_notch_pass_x_a, outline_notch_pass_y_a, "m");
 plot (outline_notch_pass_x_b, outline_notch_pass_y_b, "m");
 plot (outline_notch_stop_x, outline_notch_stop_y, "m");
 ylim ([-80, 0]);
Produces the following output
n = 3
Wn_p =

   0.4164   0.4913

Wn_s =

   0.4297   0.4777
and the following figure
| Figure 1 |
|---|
 |
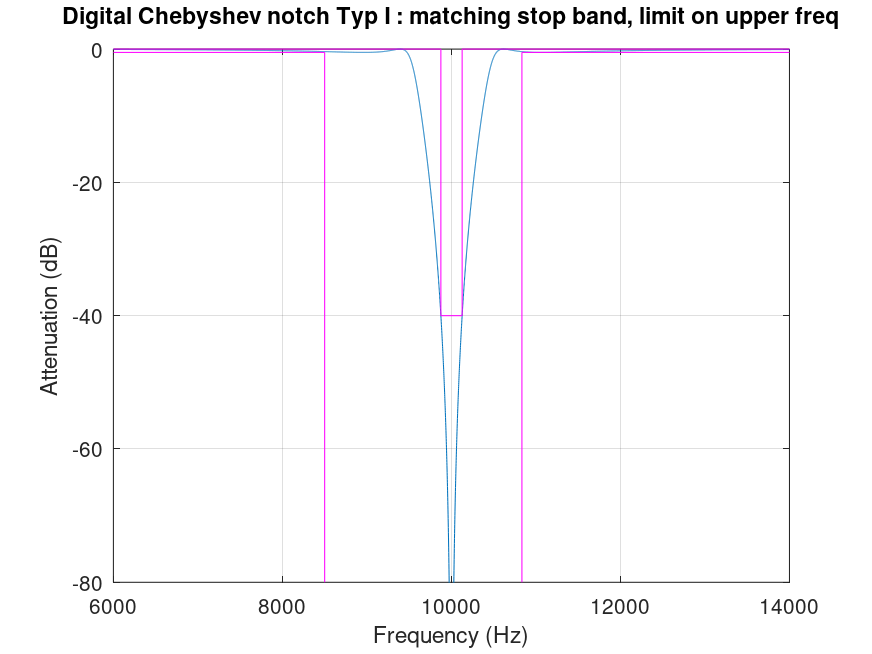
Demonstration 10
The following code
 fs    = 44100;
 fstop = [9875, 10126.5823];
 fpass = [8500, 10834];
 Rpass = 0.5;
 Rstop = 40;
 Wpass = 2 / fs * fpass;
 Wstop = 2 / fs * fstop;
 [n, Wn_p, Wn_s] = cheb1ord (Wpass, Wstop, Rpass, Rstop)
 [b, a] = cheby1 (n, Rpass, Wn_s, "stop");
 f = (6000:14000)';
 W = f * (2 * pi / fs);
 H = freqz (b, a, W);
 Ampl = abs (H);
 plot (f, 20 * log10 (abs (H)));
 title ("Digital Chebyshev notch Typ I : matching stop band, limit on upper freq");
 xlabel ("Frequency (Hz)");
 ylabel ("Attenuation (dB)");
 grid on;
 outline_notch_pass_x_a = [min(f)  , fpass(1), fpass(1)];
 outline_notch_pass_x_b = [fpass(2), fpass(2), max(f)];
 outline_notch_pass_y_a = [-Rpass  , -Rpass  , -80];
 outline_notch_pass_y_b = [-80     , -Rpass  , -Rpass];
 outline_notch_stop_x   = [min(f)  , fstop(1), fstop(1), fstop(2), ...
                                               fstop(2), max(f)];
 outline_notch_stop_y   = [0       , 0       , -Rstop  , -Rstop  , 0, 0 ];
 hold on;
 plot (outline_notch_pass_x_a, outline_notch_pass_y_a, "m");
 plot (outline_notch_pass_x_b, outline_notch_pass_y_b, "m");
 plot (outline_notch_stop_x, outline_notch_stop_y, "m");
 ylim ([-80, 0]);
Produces the following output
n = 3
Wn_p =

   0.4164   0.4913

Wn_s =

   0.4297   0.4777
and the following figure
| Figure 1 |
|---|
 |
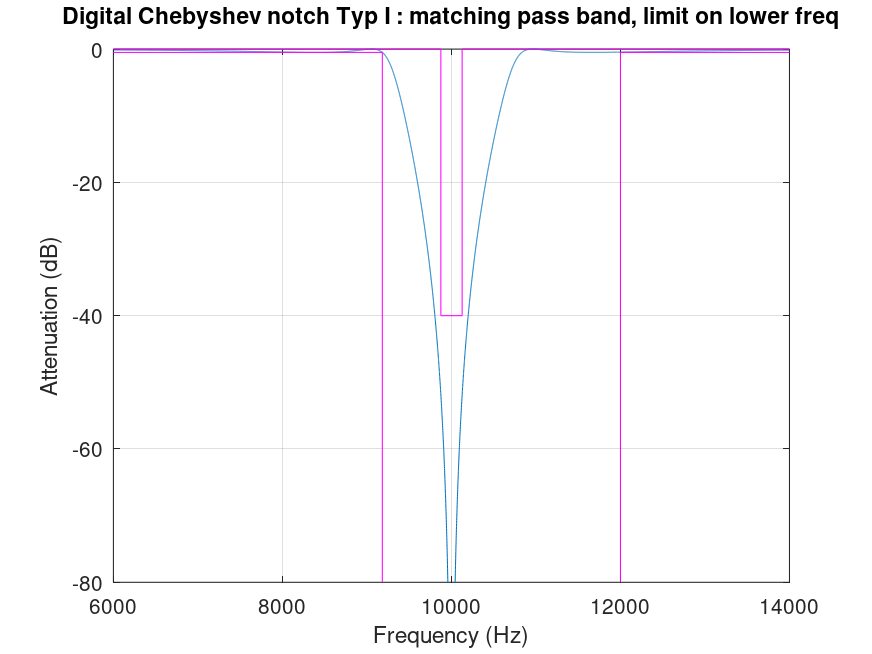
Demonstration 11
The following code
 fs    = 44100;
 fstop = [9875, 10126.5823];
 fpass = [9182, 12000];
 Rpass = 0.5;
 Rstop = 40;
 Wpass = 2 / fs * fpass;
 Wstop = 2 / fs * fstop;
 [n, Wn_p, Wn_s] = cheb1ord (Wpass, Wstop, Rpass, Rstop)
 [b, a] = cheby1 (n, Rpass, Wn_p, "stop");
 f = (6000:14000)';
 W = f * (2 * pi / fs);
 H = freqz (b, a, W);
 Ampl = abs (H);
 plot (f, 20 * log10 (abs (H)));
 title ("Digital Chebyshev notch Typ I : matching pass band, limit on lower freq");
 xlabel ("Frequency (Hz)");
 ylabel ("Attenuation (dB)");
 grid on;
 outline_notch_pass_x_a = [min(f)  , fpass(1), fpass(1)];
 outline_notch_pass_x_b = [fpass(2), fpass(2), max(f)];
 outline_notch_pass_y_a = [-Rpass  , -Rpass  , -80];
 outline_notch_pass_y_b = [-80     , -Rpass  , -Rpass];
 outline_notch_stop_x   = [min(f)  , fstop(1), fstop(1), fstop(2), ...
                                               fstop(2), max(f)];
 outline_notch_stop_y   = [0       , 0       , -Rstop  , -Rstop  , 0, 0 ];
 hold on;
 plot (outline_notch_pass_x_a, outline_notch_pass_y_a, "m");
 plot (outline_notch_pass_x_b, outline_notch_pass_y_b, "m");
 plot (outline_notch_stop_x, outline_notch_stop_y, "m");
 ylim ([-80, 0]);
Produces the following output
n = 3
Wn_p =

   0.4164   0.4913

Wn_s =

   0.4297   0.4777
and the following figure
| Figure 1 |
|---|
 |
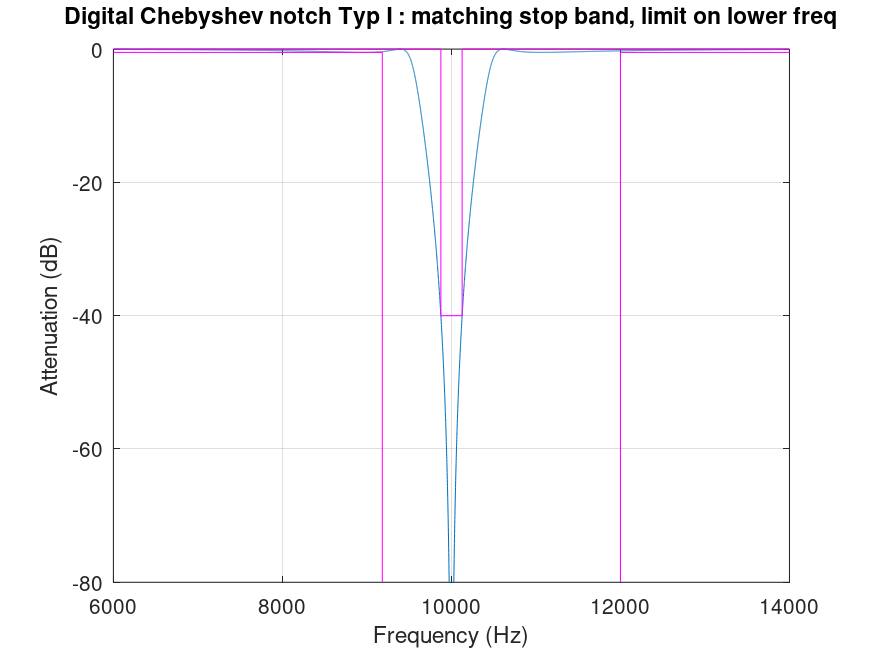
Demonstration 12
The following code
 fs    = 44100;
 fstop = [9875, 10126.5823];
 fpass = [9182, 12000];
 Rpass = 0.5;
 Rstop = 40;
 Wpass = 2 / fs * fpass;
 Wstop = 2 / fs * fstop;
 [n, Wn_p, Wn_s] = cheb1ord (Wpass, Wstop, Rpass, Rstop)
 [b, a] = cheby1 (n, Rpass, Wn_s, "stop");
 f = (6000:14000)';
 W = f * (2 * pi / fs);
 H = freqz (b, a, W);
 Ampl = abs (H);
 plot (f, 20 * log10 (abs (H)));
 title ("Digital Chebyshev notch Typ I : matching stop band, limit on lower freq");
 xlabel ("Frequency (Hz)");
 ylabel ("Attenuation (dB)");
 grid on;
 outline_notch_pass_x_a = [min(f)  , fpass(1), fpass(1)];
 outline_notch_pass_x_b = [fpass(2), fpass(2), max(f)];
 outline_notch_pass_y_a = [-Rpass  , -Rpass  , -80];
 outline_notch_pass_y_b = [-80     , -Rpass  , -Rpass];
 outline_notch_stop_x   = [min(f)  , fstop(1), fstop(1), fstop(2), ...
                                               fstop(2), max(f)];
 outline_notch_stop_y   = [0       , 0       , -Rstop  , -Rstop  , 0, 0 ];
 hold on;
 plot (outline_notch_pass_x_a, outline_notch_pass_y_a, "m");
 plot (outline_notch_pass_x_b, outline_notch_pass_y_b, "m");
 plot (outline_notch_stop_x, outline_notch_stop_y, "m");
 ylim ([-80, 0]);
Produces the following output
n = 3
Wn_p =

   0.4164   0.4913

Wn_s =

   0.4297   0.4777
and the following figure
| Figure 1 |
|---|
 |
Demonstration 13
The following code
fpass = 4000;
fstop = 13584;
Rpass = 1;
Rstop = 26;
Wpass = 2 * pi * fpass;
Wstop = 2 * pi * fstop;
[n, Wn_p, Wn_s] = cheb1ord (Wpass, Wstop, Rpass, Rstop, "s")
[b, a] = cheby1 (n, Rpass, Wn_p, "s");
f = 1000:10:100000;
W = 2 * pi * f;
H = freqs (b, a, W);
semilogx (f, 20 * log10 (abs (H)));
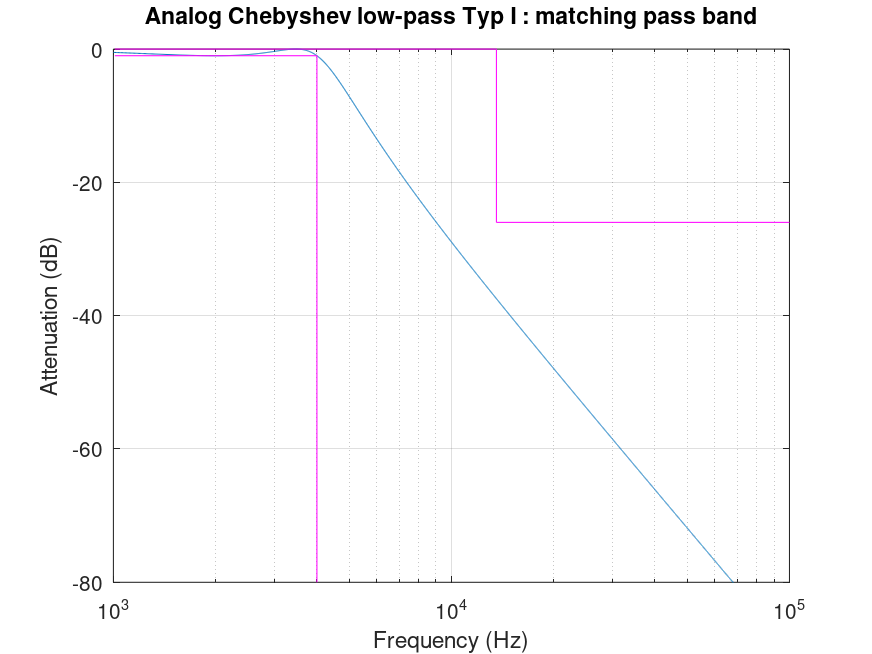
title ("Analog Chebyshev low-pass Typ I : matching pass band");
xlabel ("Frequency (Hz)");
ylabel ("Attenuation (dB)");
grid on;
outline_lp_pass_x = [f(2) , fpass(1), fpass(1)];
outline_lp_pass_y = [-Rpass, -Rpass , -80];
outline_lp_stop_x = [f(2) , fstop(1), fstop(1), max(f)];
outline_lp_stop_y = [0 , 0 , -Rstop , -Rstop];
hold on;
plot (outline_lp_pass_x, outline_lp_pass_y, "m");
plot (outline_lp_stop_x, outline_lp_stop_y, "m");
ylim ([-80, 0]);
Produces the following output
n = 3
Wn_p = 2.5133e+04
Wn_s = 3.7832e+04
and the following figure
| Figure 1 |
|---|
 |
Demonstration 14
The following code
fpass = 4000;
fstop = 13584;
Rpass = 1;
Rstop = 26;
Wpass = 2 * pi * fpass;
Wstop = 2 * pi * fstop;
[n, Wn_p, Wn_s] = cheb1ord (Wpass, Wstop, Rpass, Rstop, "s")
[b, a] = cheby1 (n, Rpass, Wn_s, "s");
f = 1000:10:100000;
W = 2 * pi * f;
H = freqs (b, a, W);
semilogx (f, 20 * log10 (abs (H)));
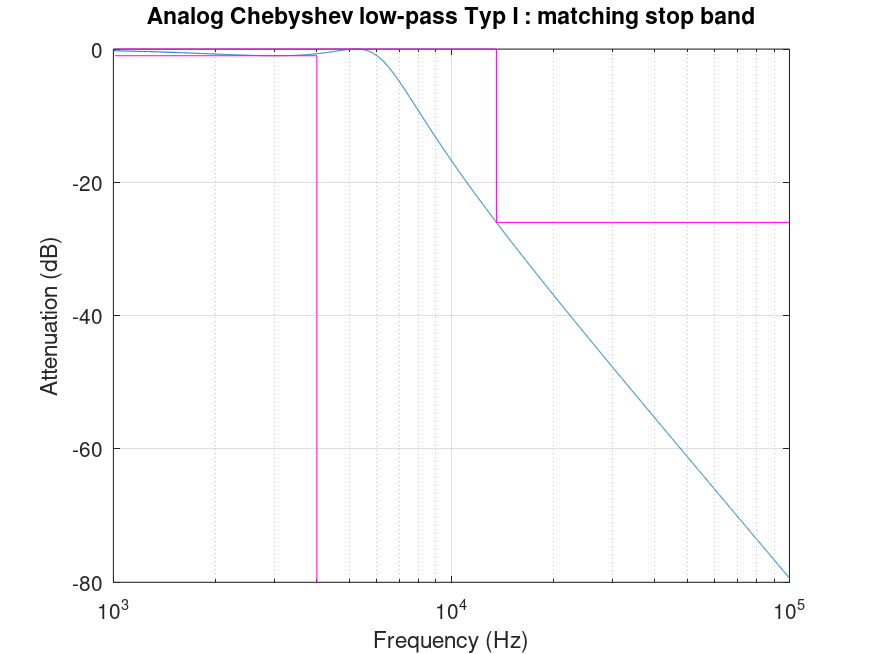
title ("Analog Chebyshev low-pass Typ I : matching stop band");
xlabel ("Frequency (Hz)");
ylabel ("Attenuation (dB)");
grid on;
outline_lp_pass_x = [f(2) , fpass(1), fpass(1)];
outline_lp_pass_y = [-Rpass, -Rpass , -80];
outline_lp_stop_x = [f(2) , fstop(1), fstop(1), max(f)];
outline_lp_stop_y = [0 , 0 , -Rstop , -Rstop];
hold on;
plot (outline_lp_pass_x, outline_lp_pass_y, "m");
plot (outline_lp_stop_x, outline_lp_stop_y, "m");
ylim ([-80, 0]);
Produces the following output
n = 3
Wn_p = 2.5133e+04
Wn_s = 3.7832e+04
and the following figure
| Figure 1 |
|---|
 |
Demonstration 15
The following code
fstop = 4000;
fpass = 13584;
Rpass = 1;
Rstop = 26;
Wpass = 2 * pi * fpass;
Wstop = 2 * pi * fstop;
[n, Wn_p, Wn_s] = cheb1ord (Wpass, Wstop, Rpass, Rstop, "s")
[b, a] = cheby1 (n, Rpass, Wn_p, "high", "s");
f = 1000:10:100000;
W = 2 * pi * f;
H = freqs (b, a, W);
semilogx (f, 20 * log10 (abs (H)));
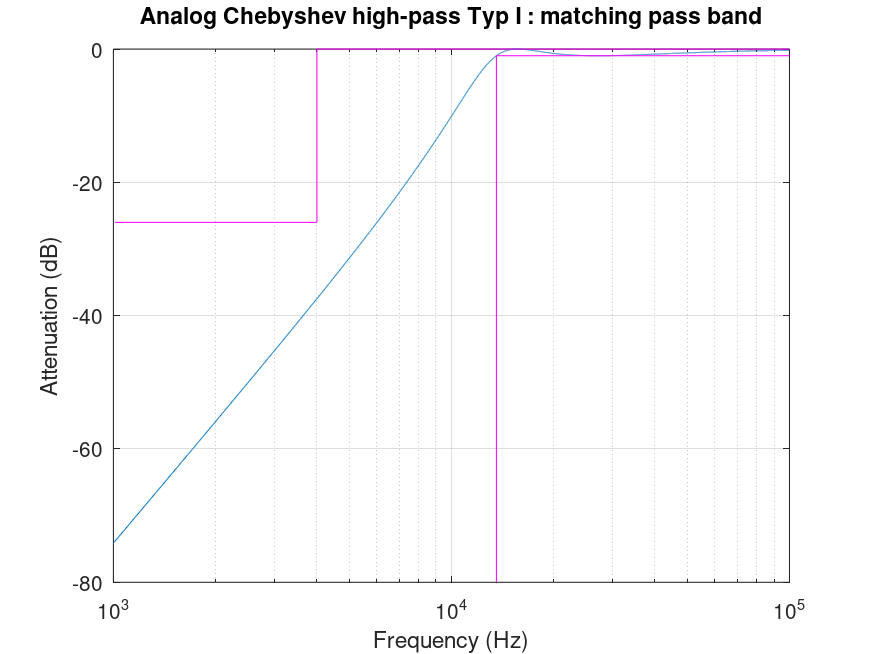
title ("Analog Chebyshev high-pass Typ I : matching pass band");
xlabel ("Frequency (Hz)");
ylabel ("Attenuation (dB)");
grid on;
outline_hp_pass_x = [fpass(1), fpass(1), max(f)];
outline_hp_pass_y = [-80 , -Rpass , -Rpass];
outline_hp_stop_x = [f(2) , fstop(1), fstop(1), max(f)];
outline_hp_stop_y = [-Rstop , -Rstop , 0 , 0 ];
hold on;
plot (outline_hp_pass_x, outline_hp_pass_y, "m");
plot (outline_hp_stop_x, outline_hp_stop_y, "m");
ylim ([-80, 0]);
Produces the following output
n = 3
Wn_p = 8.5351e+04
Wn_s = 5.6700e+04
and the following figure
| Figure 1 |
|---|
 |
Demonstration 16
The following code
fstop = 4000;
fpass = 13584;
Rpass = 1;
Rstop = 26;
Wpass = 2 * pi * fpass;
Wstop = 2 * pi * fstop;
[n, Wn_p, Wn_s] = cheb1ord (Wpass, Wstop, Rpass, Rstop, "s")
[b, a] = cheby1 (n, Rpass, Wn_s, "high", "s");
f = 1000:10:100000;
W = 2 * pi * f;
H = freqs (b, a, W);
semilogx (f, 20 * log10 (abs (H)));
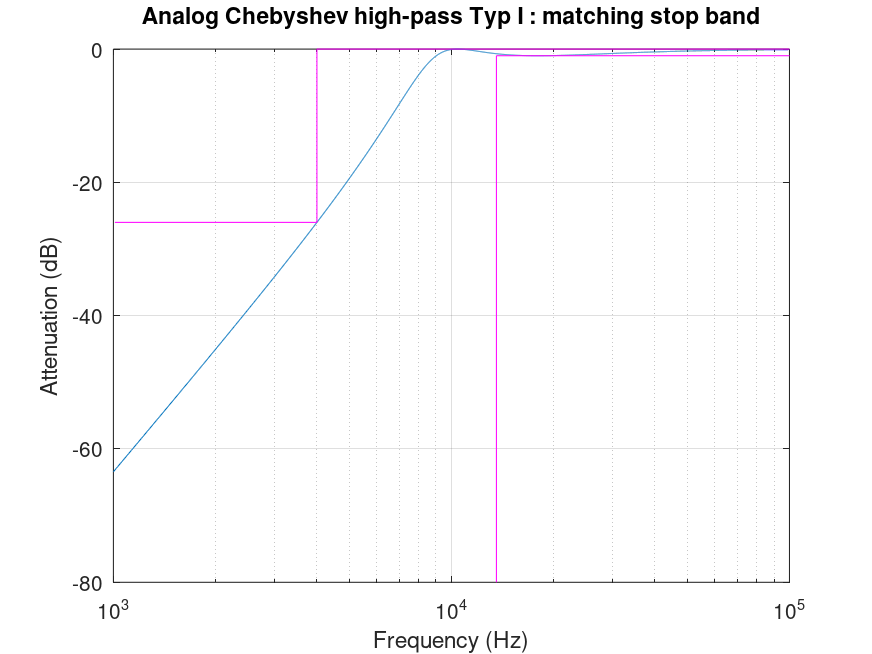
title ("Analog Chebyshev high-pass Typ I : matching stop band");
xlabel ("Frequency (Hz)");
ylabel ("Attenuation (dB)");
grid on;
outline_hp_pass_x = [fpass(1), fpass(1), max(f)];
outline_hp_pass_y = [-80 , -Rpass , -Rpass];
outline_hp_stop_x = [f(2) , fstop(1), fstop(1), max(f)];
outline_hp_stop_y = [-Rstop , -Rstop , 0 , 0 ];
hold on;
plot (outline_hp_pass_x, outline_hp_pass_y, "m");
plot (outline_hp_stop_x, outline_hp_stop_y, "m");
ylim ([-80, 0]);
Produces the following output
n = 3
Wn_p = 8.5351e+04
Wn_s = 5.6700e+04
and the following figure
| Figure 1 |
|---|
 |
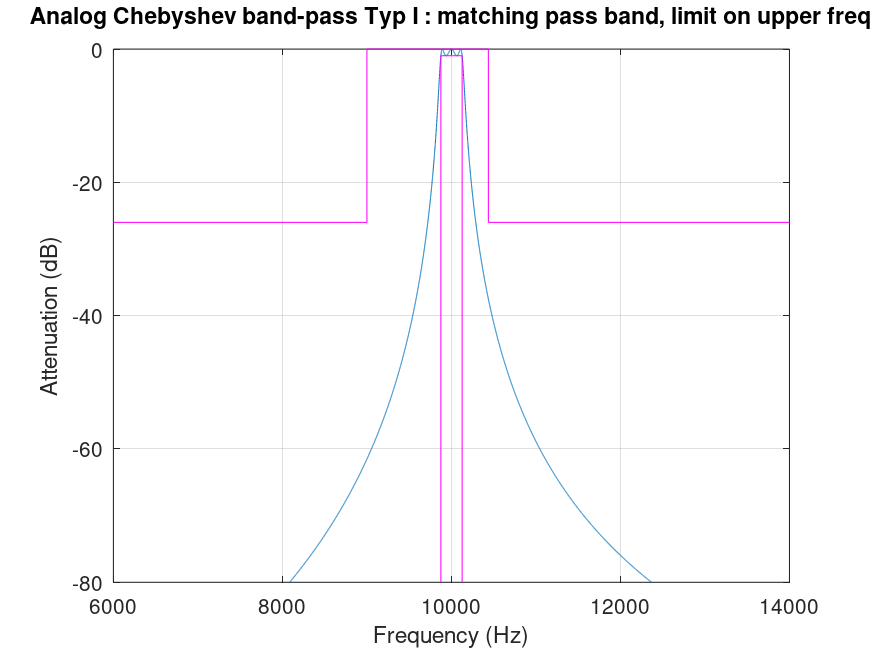
Demonstration 17
The following code
 fpass = [9875, 10126.5823];
 fstop = [9000, 10437];
 Rpass = 1;
 Rstop = 26;
 Wpass = 2 * pi * fpass;
 Wstop = 2 * pi * fstop;
 [n, Wn_p, Wn_s] = cheb1ord (Wpass, Wstop, Rpass, Rstop, "s")
 [b, a] = cheby1 (n, Rpass, Wn_p, "s");
 f = 6000:14000;
 W = 2 * pi * f;
 H = freqs (b, a, W);
 plot (f, 20 * log10 (abs (H)));
 title ("Analog Chebyshev band-pass Typ I : matching pass band, limit on upper freq");
 xlabel ("Frequency (Hz)");
 ylabel ("Attenuation (dB)");
 grid on;
 outline_bp_pass_x = [fpass(1), fpass(1), fpass(2), fpass(2)];
 outline_bp_pass_y = [-80     , -Rpass  , -Rpass  , -80];
 outline_bp_stop_x = [f(2)    , fstop(1), fstop(1), fstop(2), ...
                                                    fstop(2), max(f)];
 outline_bp_stop_y = [-Rstop  , -Rstop  , 0       , 0       , ...
                                                    -Rstop  , -Rstop];
 hold on
 plot (outline_bp_pass_x, outline_bp_pass_y, "m");
 plot (outline_bp_stop_x, outline_bp_stop_y, "m");
 grid on;
 ylim ([-80, 0]);
Produces the following output
n = 3
Wn_p =

   6.2046e+04   6.3627e+04

Wn_s =

   6.1652e+04   6.4035e+04
and the following figure
| Figure 1 |
|---|
 |
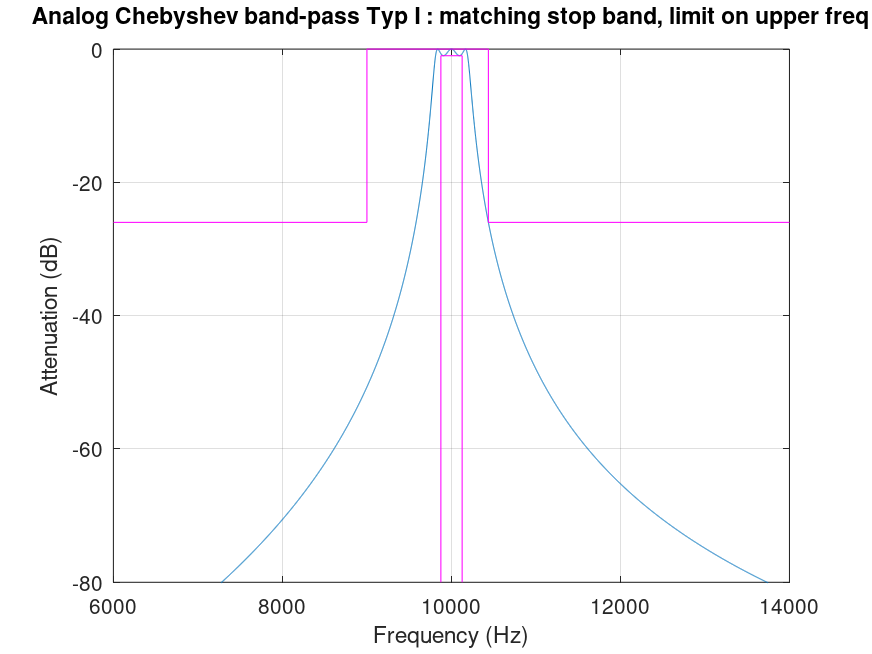
Demonstration 18
The following code
 fpass = [9875, 10126.5823];
 fstop = [9000, 10437];
 Rpass = 1;
 Rstop = 26;
 Wpass = 2 * pi * fpass;
 Wstop = 2 * pi * fstop;
 [n, Wn_p, Wn_s] = cheb1ord (Wpass, Wstop, Rpass, Rstop, "s")
 [b, a] = cheby1 (n, Rpass, Wn_s, "s");
 f = 6000:14000;
 W = 2 * pi * f;
 H = freqs (b, a, W);
 plot (f, 20 * log10 (abs (H)));
 title ("Analog Chebyshev band-pass Typ I : matching stop band, limit on upper freq");
 xlabel ("Frequency (Hz)");
 ylabel ("Attenuation (dB)");
 grid on;
 outline_bp_pass_x = [fpass(1), fpass(1), fpass(2), fpass(2)];
 outline_bp_pass_y = [-80     , -Rpass  , -Rpass  , -80];
 outline_bp_stop_x = [f(2)    , fstop(1), fstop(1), fstop(2), ...
                                                    fstop(2), max(f)];
 outline_bp_stop_y = [-Rstop  , -Rstop  , 0       , 0       , ...
                                                    -Rstop  , -Rstop];
 hold on
 plot (outline_bp_pass_x, outline_bp_pass_y, "m");
 plot (outline_bp_stop_x, outline_bp_stop_y, "m");
 grid on;
 ylim ([-80, 0]);
Produces the following output
n = 3
Wn_p =

   6.2046e+04   6.3627e+04

Wn_s =

   6.1652e+04   6.4035e+04
and the following figure
| Figure 1 |
|---|
 |
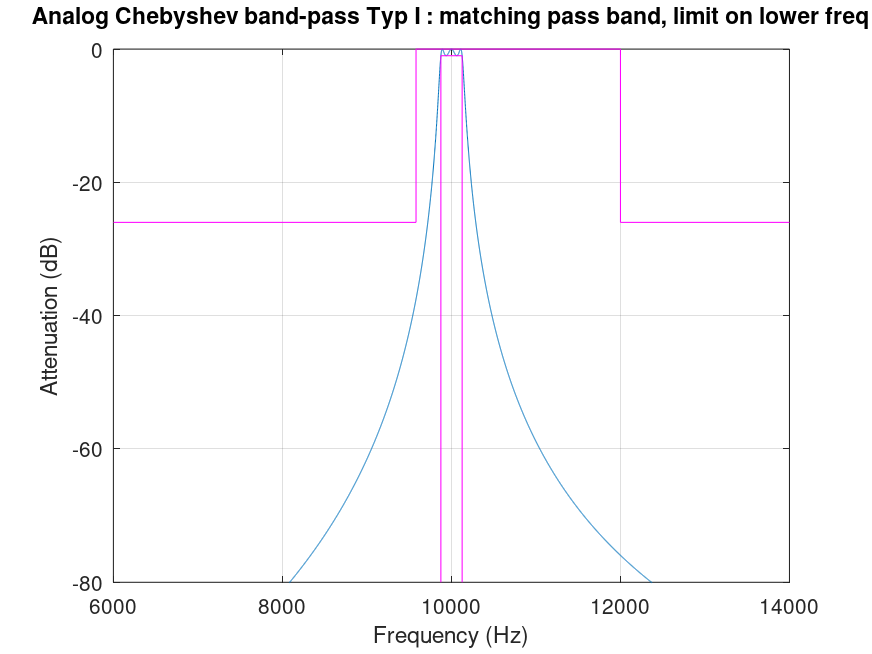
Demonstration 19
The following code
 fpass = [9875, 10126.5823];
 fstop = [9581, 12000];
 Rpass = 1;
 Rstop = 26;
 Wpass = 2 * pi * fpass;
 Wstop = 2 * pi * fstop;
 [n, Wn_p, Wn_s] = cheb1ord (Wpass, Wstop, Rpass, Rstop, "s")
 [b, a] = cheby1 (n, Rpass, Wn_p, "s");
 f = 6000:14000;
 W = 2 * pi * f;
 H = freqs (b, a, W);
 plot (f, 20 * log10 (abs (H)));
 title ("Analog Chebyshev band-pass Typ I : matching pass band, limit on lower freq");
 xlabel ("Frequency (Hz)");
 ylabel ("Attenuation (dB)");
 grid on;
 outline_bp_pass_x = [fpass(1), fpass(1), fpass(2), fpass(2)];
 outline_bp_pass_y = [-80     , -Rpass  , -Rpass  , -80];
 outline_bp_stop_x = [f(2)    , fstop(1), fstop(1), fstop(2), ...
                                                    fstop(2), max(f)];
 outline_bp_stop_y = [-Rstop  , -Rstop  , 0       , 0       , ...
                                                    -Rstop  , -Rstop];
 hold on
 plot (outline_bp_pass_x, outline_bp_pass_y, "m");
 plot (outline_bp_stop_x, outline_bp_stop_y, "m");
 grid on;
 ylim ([-80, 0]);
Produces the following output
n = 3
Wn_p =

   6.2046e+04   6.3627e+04

Wn_s =

   6.1651e+04   6.4036e+04
and the following figure
| Figure 1 |
|---|
 |
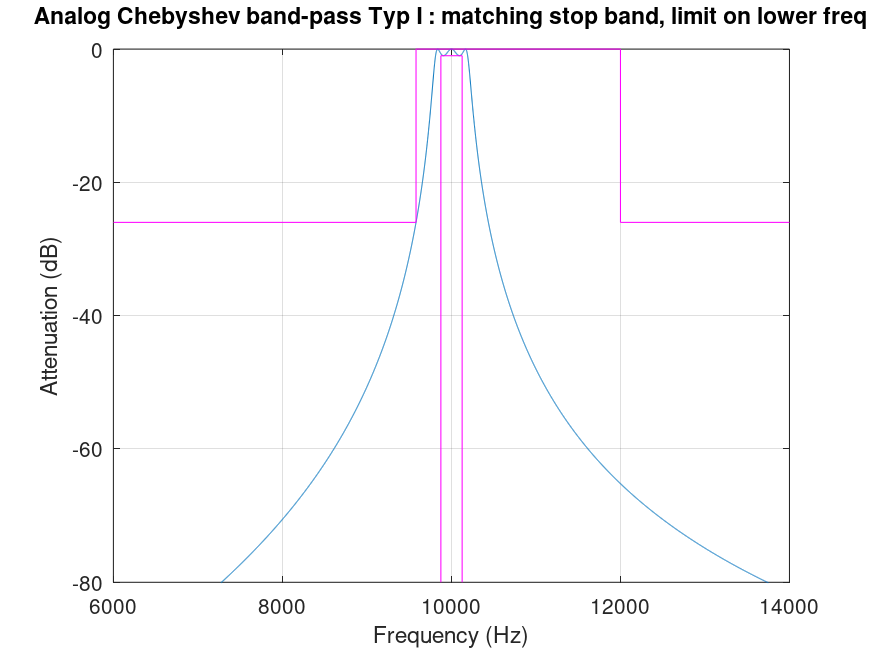
Demonstration 20
The following code
 fpass = [9875, 10126.5823];
 fstop = [9581, 12000];
 Rpass = 1;
 Rstop = 26;
 Wpass = 2 * pi * fpass;
 Wstop = 2 * pi * fstop;
 [n, Wn_p, Wn_s] = cheb1ord (Wpass, Wstop, Rpass, Rstop, "s")
 [b, a] = cheby1 (n, Rpass, Wn_s, "s");
 f = 6000:14000;
 W = 2 * pi * f;
 H = freqs (b, a, W);
 plot (f, 20 * log10 (abs (H)));
 title ("Analog Chebyshev band-pass Typ I : matching stop band, limit on lower freq");
 xlabel ("Frequency (Hz)");
 ylabel ("Attenuation (dB)");
 grid on;
 outline_bp_pass_x = [fpass(1), fpass(1), fpass(2), fpass(2)];
 outline_bp_pass_y = [-80     , -Rpass  , -Rpass  , -80];
 outline_bp_stop_x = [f(2)    , fstop(1), fstop(1), fstop(2), ...
                                                    fstop(2), max(f)];
 outline_bp_stop_y = [-Rstop  , -Rstop  , 0       , 0       , ...
                                                    -Rstop  , -Rstop];
 hold on
 plot (outline_bp_pass_x, outline_bp_pass_y, "m");
 plot (outline_bp_stop_x, outline_bp_stop_y, "m");
 grid on;
 ylim ([-80, 0]);
Produces the following output
n = 3
Wn_p =

   6.2046e+04   6.3627e+04

Wn_s =

   6.1651e+04   6.4036e+04
and the following figure
| Figure 1 |
|---|
 |
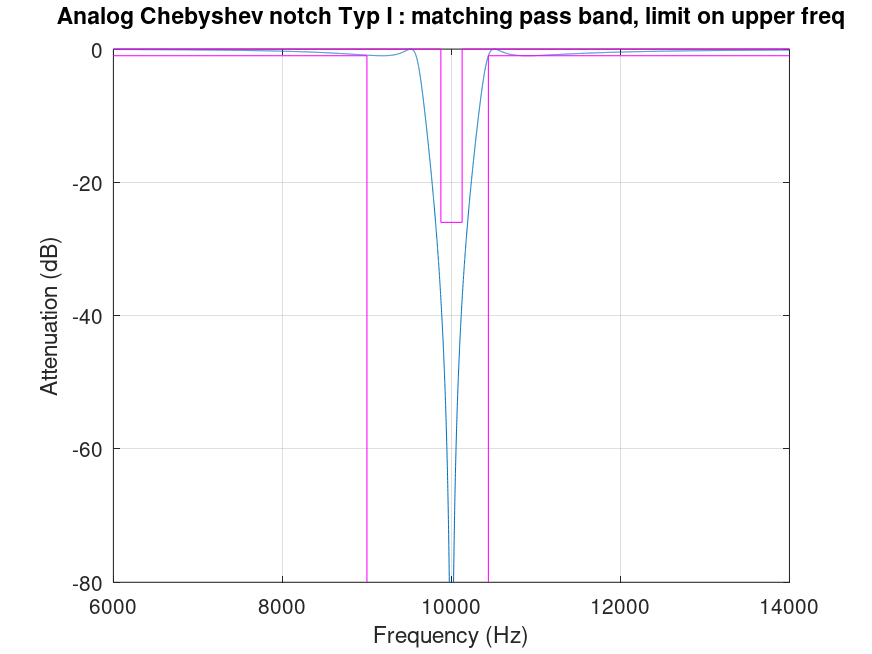
Demonstration 21
The following code
 fstop = [9875, 10126.5823];
 fpass = [9000, 10437];
 Rpass = 1;
 Rstop = 26;
 Wpass = 2 * pi * fpass;
 Wstop = 2 * pi * fstop;
 [n, Wn_p, Wn_s] = cheb1ord (Wpass, Wstop, Rpass, Rstop, "s")
 [b, a] = cheby1 (n, Rpass, Wn_p, "stop", "s");
 f = 6000:14000;
 W = 2 * pi * f;
 H = freqs (b, a, W);
 plot (f, 20 * log10 (abs (H)));
 title ("Analog Chebyshev notch Typ I : matching pass band, limit on upper freq");
 xlabel ("Frequency (Hz)");
 ylabel ("Attenuation (dB)");
 grid on;
 outline_notch_pass_x_a = [f(2)    , fpass(1), fpass(1)];
 outline_notch_pass_x_b = [fpass(2), fpass(2), max(f)];
 outline_notch_pass_y_a = [-Rpass  , -Rpass  , -80];
 outline_notch_pass_y_b = [-80     , -Rpass  , -Rpass];
 outline_notch_stop_x   = [f(2)    , fstop(1), fstop(1), fstop(2), ...
                                               fstop(2), max(f)];
 outline_notch_stop_y   = [0       , 0       , -Rstop  , -Rstop  , 0, 0 ];
 hold on
 plot (outline_notch_pass_x_a, outline_notch_pass_y_a, "m");
 plot (outline_notch_pass_x_b, outline_notch_pass_y_b, "m");
 plot (outline_notch_stop_x, outline_notch_stop_y, "m");
 ylim ([-80, 0]);
Produces the following output
n = 3
Wn_p =

   6.0201e+04   6.5578e+04

Wn_s =

   6.1074e+04   6.4640e+04
and the following figure
| Figure 1 |
|---|
 |
Demonstration 22
The following code
 fstop = [9875, 10126.5823];
 fpass = [9000, 10437];
 Rpass = 1;
 Rstop = 26;
 Wpass = 2 * pi * fpass;
 Wstop = 2 * pi * fstop;
 [n, Wn_p, Wn_s] = cheb1ord (Wpass, Wstop, Rpass, Rstop, "s")
 [b, a] = cheby1 (n, Rpass, Wn_s, "stop", "s");
 f = 6000:14000;
 W = 2 * pi * f;
 H = freqs (b, a, W);
 plot (f, 20 * log10 (abs (H)));
 title ("Analog Chebyshev notch Typ I : matching stop band, limit on upper freq");
 xlabel ("Frequency (Hz)");
 ylabel ("Attenuation (dB)");
 grid on;
 outline_notch_pass_x_a = [f(2)    , fpass(1), fpass(1)];
 outline_notch_pass_x_b = [fpass(2), fpass(2), max(f)];
 outline_notch_pass_y_a = [-Rpass  , -Rpass  , -80];
 outline_notch_pass_y_b = [-80     , -Rpass  , -Rpass];
 outline_notch_stop_x   = [f(2)    , fstop(1), fstop(1), fstop(2), ...
                                               fstop(2), max(f)];
 outline_notch_stop_y   = [0       , 0       , -Rstop  , -Rstop  , 0, 0 ];
 hold on
 plot (outline_notch_pass_x_a, outline_notch_pass_y_a, "m");
 plot (outline_notch_pass_x_b, outline_notch_pass_y_b, "m");
 plot (outline_notch_stop_x, outline_notch_stop_y, "m");
 ylim ([-80, 0]);
Produces the following output
n = 3
Wn_p =

   6.0201e+04   6.5578e+04

Wn_s =

   6.1074e+04   6.4640e+04
and the following figure
| Figure 1 |
|---|
 |
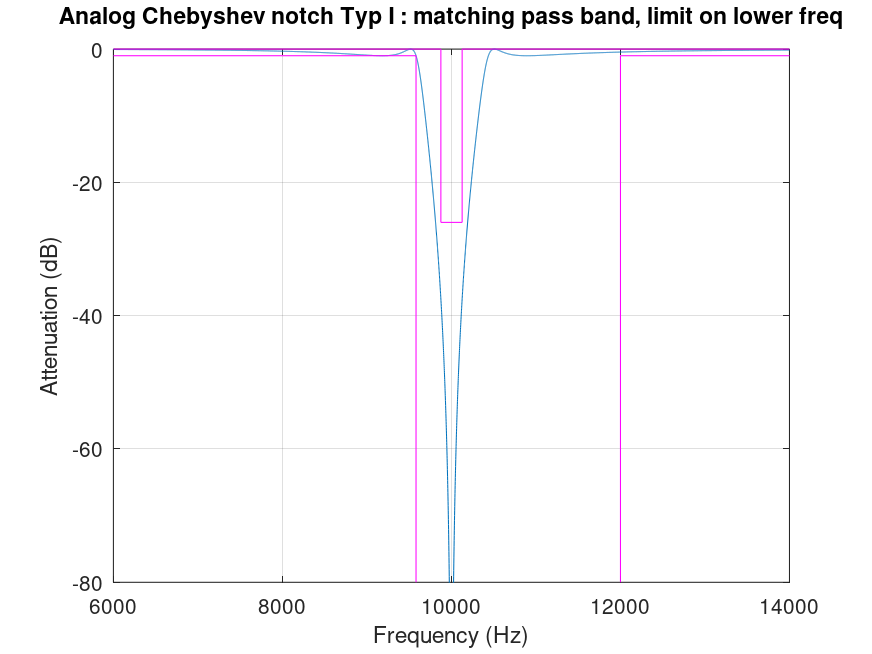
Demonstration 23
The following code
 fstop = [9875, 10126.5823];
 fpass = [9581 12000];
 Rpass = 1;
 Rstop = 26;
 Wpass = 2 * pi * fpass;
 Wstop = 2 * pi * fstop;
 [n, Wn_p, Wn_s] = cheb1ord (Wpass, Wstop, Rpass, Rstop, "s")
 [b, a] = cheby1 (n, Rpass, Wn_p, "stop", "s");
 f = 6000:14000;
 W = 2 * pi * f;
 H = freqs (b, a, W);
 plot (f, 20 * log10 (abs (H)));
 title ("Analog Chebyshev notch Typ I : matching pass band, limit on lower freq");
 xlabel ("Frequency (Hz)");
 ylabel ("Attenuation (dB)");
 grid on;
 outline_notch_pass_x_a = [f(2)    , fpass(1), fpass(1)];
 outline_notch_pass_x_b = [fpass(2), fpass(2), max(f)];
 outline_notch_pass_y_a = [-Rpass  , -Rpass  , -80];
 outline_notch_pass_y_b = [-80     , -Rpass  , -Rpass];
 outline_notch_stop_x   = [f(2)    , fstop(1), fstop(1), fstop(2), ...
                                               fstop(2), max(f)];
 outline_notch_stop_y   = [0       , 0       , -Rstop  , -Rstop  , 0, 0 ];
 hold on
 plot (outline_notch_pass_x_a, outline_notch_pass_y_a, "m");
 plot (outline_notch_pass_x_b, outline_notch_pass_y_b, "m");
 plot (outline_notch_stop_x, outline_notch_stop_y, "m");
 ylim ([-80, 0]);
Produces the following output
n = 3
Wn_p =

   6.0199e+04   6.5580e+04

Wn_s =

   6.1074e+04   6.4640e+04
and the following figure
| Figure 1 |
|---|
 |
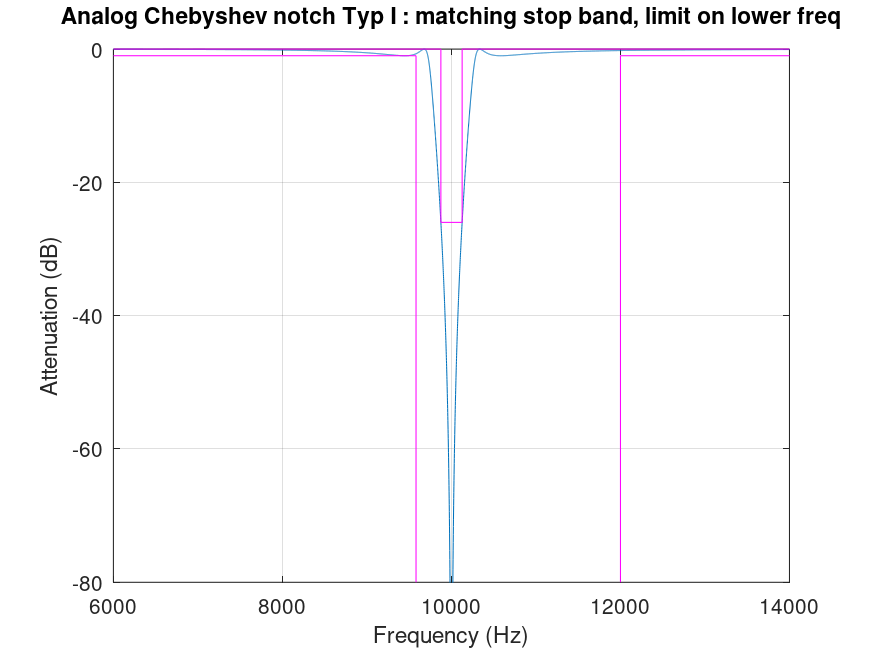
Demonstration 24
The following code
 fstop = [9875, 10126.5823];
 fpass = [9581 12000];
 Rpass = 1;
 Rstop = 26;
 Wpass = 2 * pi * fpass;
 Wstop = 2 * pi * fstop;
 [n, Wn_p, Wn_s] = cheb1ord (Wpass, Wstop, Rpass, Rstop, "s")
 [b, a] = cheby1 (n, Rpass, Wn_s, "stop", "s");
 f = 6000:14000;
 W = 2 * pi * f;
 H = freqs (b, a, W);
 plot (f, 20 * log10 (abs (H)));
 title ("Analog Chebyshev notch Typ I : matching stop band, limit on lower freq");
 xlabel ("Frequency (Hz)");
 ylabel ("Attenuation (dB)");
 grid on;
 outline_notch_pass_x_a = [f(2)    , fpass(1), fpass(1)];
 outline_notch_pass_x_b = [fpass(2), fpass(2), max(f)];
 outline_notch_pass_y_a = [-Rpass  , -Rpass  , -80];
 outline_notch_pass_y_b = [-80     , -Rpass  , -Rpass];
 outline_notch_stop_x   = [f(2)    , fstop(1), fstop(1), fstop(2), ...
                                               fstop(2), max(f)];
 outline_notch_stop_y   = [0       , 0       , -Rstop  , -Rstop  , 0, 0 ];
 hold on
 plot (outline_notch_pass_x_a, outline_notch_pass_y_a, "m");
 plot (outline_notch_pass_x_b, outline_notch_pass_y_b, "m");
 plot (outline_notch_stop_x, outline_notch_stop_y, "m");
 ylim ([-80, 0]);
Produces the following output
n = 3
Wn_p =

   6.0199e+04   6.5580e+04

Wn_s =

   6.1074e+04   6.4640e+04
and the following figure
| Figure 1 |
|---|
 |
Package: signal