- Function File:
[y, ym] =rceps(x)¶ Return the cepstrum of the signal x.
If x is a matrix, return the cepstrum of each column.
If called with two output arguments, the minimum phase reconstruction of the signal x is returned in ym.
For example:
f0 = 70; Fs = 10000;            # 100 Hz fundamental, 10kHz sampling rate
a = poly (0.985 * exp (1i * pi * [0.1, -0.1, 0.3, -0.3])); # two formants
s = 0.005 * randn (1024, 1);    # Noise excitation signal
s(1:Fs/f0:length(s)) = 1;       # Impulse glottal wave
x = filter (1, a, s);           # Speech signal
[y, ym] = rceps (x .* hanning (1024));
Reference: Programs for Digital Signal Processing, IEEE Press, John Wiley & Sons, New York, 1979.
Demonstration 1
The following code
f0 = 70; Fs = 10000; # 100 Hz fundamental, 10 kHz sampling rate
a = real (poly (0.985 * exp (1i * pi * [0.1, -0.1, 0.3, -0.3]))); # two formants
s = 0.05 * randn (1024, 1); # Noise excitation signal
s(floor (1:Fs/f0:length (s))) = 1; # Impulse glottal wave
x = filter (1, a, s); # Speech signal in x
[y, xm] = rceps (x); # cepstrum and minimum phase x
[hx, w] = freqz (x, 1, [], Fs);
hxm = freqz (xm);
figure (1);
subplot (311);
len = 1000 * fix (min (length (x), length (xm)) / 1000);
plot ([0:len-1] * 1000 / Fs, x(1:len), "b;signal;", ...
[0:len-1] * 1000 / Fs, xm(1:len), "g;reconstruction;");
ylabel ("Amplitude");
xlabel ("Time (ms)");
subplot (312);
axis ("ticy");
plot (w, log (abs (hx)), ";magnitude;", ...
w, log (abs (hxm)), ";reconstruction;");
xlabel ("Frequency (Hz)");
subplot (313);
axis ("on");
plot (w, unwrap (arg (hx)) / (2 * pi), ";phase;", ...
w, unwrap (arg (hxm)) / (2 * pi), ";reconstruction;");
xlabel ("Frequency (Hz)");
len = 1000 * fix (length (y) / 1000);
figure (2);
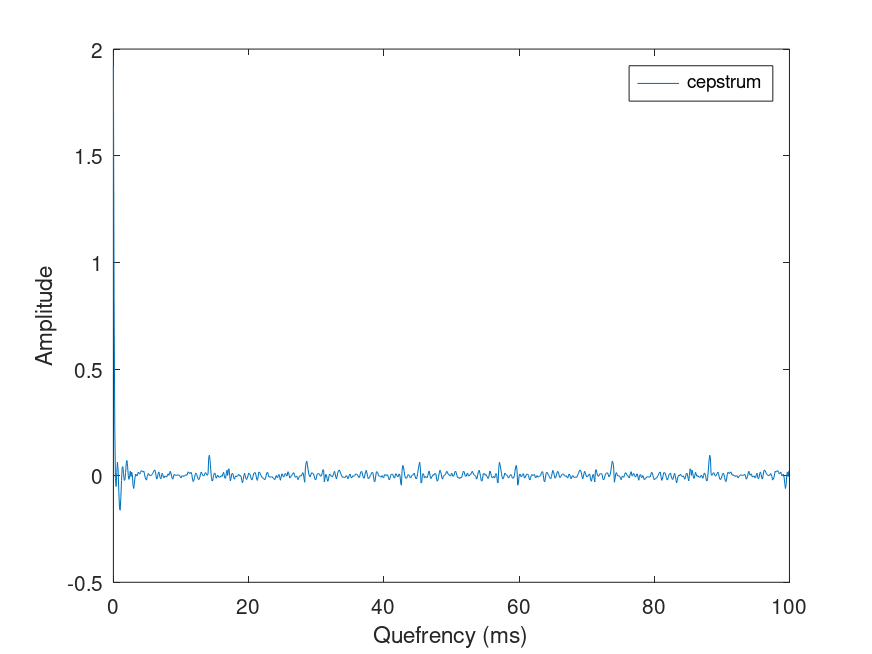
plot ([0:len-1] * 1000 / Fs, y(1:len), ";cepstrum;");
ylabel ("Amplitude");
xlabel ("Quefrency (ms)");
%-------------------------------------------------------------
% confirm the magnitude spectrum is identical in the signal
% and the reconstruction and that there are peaks in the
% cepstrum at 14 ms intervals corresponding to an F0 of 70 Hz.
Produces the following figures
| Figure 1 | Figure 2 |
|---|---|
 |
 |
Package: signal